Novel candidate markers for early prediction of severe acute pancreatitis identified by serum proteomics


 CC BY-NC-SA 4.0
Novel candidate markers for early prediction of severe acute pancreatitis identified by serum proteomics
Introduction
Based on recent Global Burden of Disease data,1 Eastern and Central Europe are among the regions with the highest incidence of pancreatitis. Acute pancreatitis (AP), caused mainly by gallstones and excessive alcohol consumption, is characterized by premature activation of pancreatic enzymes resulting in tissue damage and inflammation.2 In most patients, the inflammation is local and self‑limiting (mild AP [MAP]). However, up to 20% of patients develop systemic inflammation and organ failure that persist for over 48 hours (severe AP [SAP]), which is associated with a mortality rate of 10%–40%. Further 15%–35% develop moderately severe disease characterized by transient organ failure (limited to <48 h) or local (ie, pancreatic or peripancreatic fluid collections, including necrotic lesions) or systemic complications (exacerbation of comorbidities) associated with the need for intensive care, prolonged hospital stays, and a risk of death (1%–3%).3,4 According to current guidelines,3 AP severity is classified based on the development of local or systemic complications and the presence of transient or persistent organ failure in the course of the disease; therefore, it can only be determined at the end of an AP episode. Despite ongoing research, early recognition of patients at a risk of SAP, although necessary for timely and effective selection of those who may benefit from treatment in high‑reference centers or intensive care units, remains challenging in the clinical setting.5 One way to overcome the problem of poor diagnostic performance of currently used markers or scores involves machine learning models based on widely available clinical and laboratory variables. Another approach (which offers a potential advantage of broadening the understanding of underlying pathomechanisms) is to seek for better biomarkers using high‑throughput laboratory techniques, such as proteomics.6,7
Studies on AP implementing modern proteomic techniques are scarce. Therefore, our aim was to compare serum proteomes in MAP and SAP in samples collected early after the onset of AP, using up‑to‑date methodology, to deepen the insights into the early mechanisms of SAP and identify potential biomarkers for early differential diagnosis.
Patients and methods
Study design and sample selection
In this observational study, we analyzed samples obtained from patients with AP recruited at a secondary‑care District Hospital in Sucha Beskidzka, Poland. The study included adult patients with AP admitted to the surgery department within the first 12 hours of the symptom onset who gave their informed consent for participation. Exclusion criteria comprised disease of the pancreas other than AP, active malignancy, liver disease (eg, viral hepatitis or liver cirrhosis), and pregnancy. The diagnosis of AP and severity classification were directly based on the 2012 Revised Atlanta Classification.3 Serum samples were collected thrice: on the day of admission (day 1) and on 2 following days. Blood was collected to vacuum tubes containing activator of coagulation and separator gel, centrifuged within 30 minutes of collection, aliquoted, and frozen. The aliquots were kept at –80 °C until analysis. Clinical data were retrieved from the patients’ records generated during the hospital stay. The study protocol was approved by the Jagiellonian University Bioethical Committee (1072.6120.74.2022).
Proteomic analysis was performed on serum samples collected on the day of admission (day 1) and on day 2 of hospital stay. The samples were selected based on the AP severity assessed retrospectively (at the end of hospital stay). The analysis involved the samples from all recruited patients who were diagnosed with SAP and from selected patients with MAP in whom all AP symptoms resolved within 72 hours of the onset and no exacerbation of chronic comorbidities was observed.
Direct data‑independent acquisition quantitative proteomic analysis
Proteomic analysis was carried out in accordance with a previously published protocol.8 Briefly, serum samples were depleted with High Select depletion spin columns (Thermo Scientific, Waltham, Massachusetts, United States) and digested to peptides using the filter‑aided sample preparation protocol.9 Peptides (1 µg) were injected into a nanoliquid chromatography–mass spectrometry system (UltiMate 3000 coupled with Orbitrap Exploris 480; Thermo Scientific) and analyzed in the data‑independent acquisition (DIA) mode. Mass spectrometry data were analyzed with the directDIA algorithm using Spectronaut 19 software (Biognosys, Schlieren, Switzerland).10 Statistical testing for differential protein abundance was performed using t tests with multiple testing correction, as described by Storey.11 Functional grouping and pathway annotations were performed using ClueGO12 in the Cytoscape 3.8.2 software environment.13
Statistical analysis
Clinical and laboratory data of the study patients were presented as number and percentage of the group for categories or median and range for quantities. MAP and SAP subgroups were compared using the Fisher exact test (2 × 2 Tables), Pearson χ2 test (larger contingency Tables), or Mann–Whitney test (quantitative variables; due to skewed distributions). All statistical tests were 2‑tailed, and a P value below 0.05 indicated significant results. Statistica 13.0 software (Tibco Inc., Tulsa, Oklahoma, United States) was used for computation. GraphPad Prism 10 (GraphPad Software LLC, Boston, Massachusetts, United States) was used to generate Figures.
Results
The initial study recruited 70 patients: 8 with SAP, 31 with moderately severe AP, and 31 with MAP. For the proteomic analysis, serum samples of 20 patients were selected: 11 men and 9 women, at a median age of 59 years (range, 29–97 y). A majority of the selected patients were diagnosed with the first episode of AP (n = 18; 90%) of biliary (n = 10; 50%) or alcohol (n = 7; 35%) etiology, and presented with chronic comorbidities (n = 15; 75%). Detailed clinical characteristics of the patients with SAP (n = 8) and MAP (n = 12) whose samples were analyzed are shown in Supplementary material, Table S1. The SAP and MAP groups were similar in terms of age, sex, etiology of AP, and comorbidities, but the rate of complications (most importantly organ failure in all 8 SAP patients and pancreatic necrosis in half of them) and treatment differed according to the AP severity. Three deaths occurred in the SAP group, including 2 early (1 patient died on day 2, limiting the number of available serum samples from day 2, and 1 on day 3 of hospital stay) and 1 late (on day 36).
Since the study focused on the earliest phase of AP, the proteomic analysis involved serum samples collected on the first 2 days of hospital stay (the day of admission [day 1] and day 2). The acquired DIA data were analyzed with the library‑free directDIA approach using the Spectronaut software to identify and quantify serum proteins. On average, 1316 protein groups were identified with high confidence (protein false discovery rate <1%) in each depleted serum sample (Figure 1A). The high sensitivity of the DIA measurements was evidenced by the dynamic range of the identifications obtained, estimated to cover over 4 orders of magnitude difference between the most abundant and least abundant serum proteins (Figure 1B). To create a robust and reliable quantitative dataset, we selected only the proteins that were identified in at least 80% of the samples by at least 2 unique peptides, and performed a missing value imputation using a global imputation strategy, where the missing values were imputed on the basis of random sampling from a distribution of low‑abundance signals collected across the experimental measurements. This resulted in the generation of a dataset of 872 proteins quantified in each sample. The estimated absolute fold change cutoff was set at 2 to ensure the power of the statistical analysis to exceed 0.8 in all comparisons. Although the principal component analysis evidenced a high degree of similarity between the study cohorts (Figure 1C), on average, 60 protein groups (ranging from 25 to 96) differed in serum abundance depending on the comparison (Supplementary material, Figure S1A and Tables S2–S5). Three proteins differed significantly in all comparisons (patients with MAP vs SAP on day 1 and day 2), namely, C‑reactive protein (CRP), protein S100A7, and V‑set and immunoglobulin domain–containing 4 (VSIG4; Supplementary material, Figure S1B–S1D).
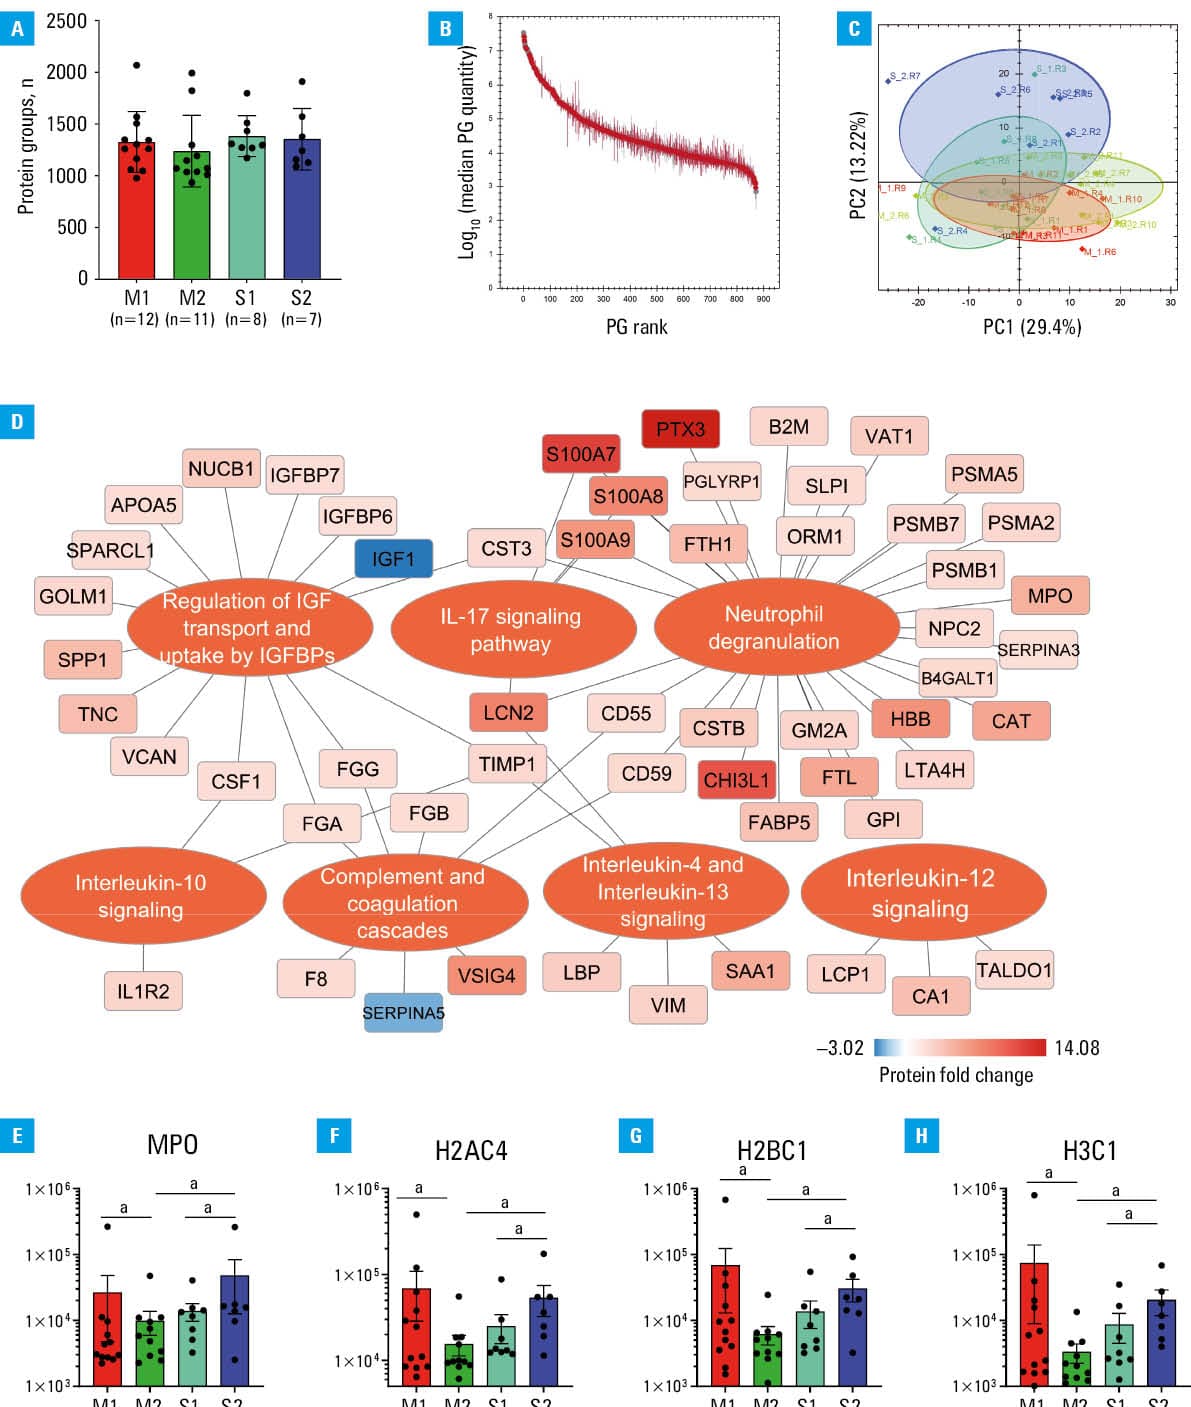
Pathway enrichment analysis based on serum proteomic data indicated that the most significantly altered processes between mild and severe AP were associated with immune system activation, with neutrophil degranulation emerging as a key feature (Figure 1D). Importantly, we observed differential expression of proteins associated with neutrophil extracellular trap (NET) formation (NETosis), including myeloperoxidase and histones, which varied according to disease severity: their levels decreased over time in mild cases, while increasing in severe ones (Figure 1E–1H). Furthermore, serum proteome profiling showed alterations in the abundance of proteins that regulate insulin‑like growth factor (IGF) signaling (Figure 1D). Specifically, in SAP, circulating levels of IGF‑binding proteins (ie, IGFBP6 and IGFBP7—components of the senescence‑associated secretory phenotype that modulate IGF activity and inflammatory responses) were elevated, as compared with mild cases. Notably, regulation of IGF signaling through its binding proteins, along with modulation of pro- and anti‑inflammatory cytokine activities, was associated with the induction of a tissue inhibitor of metalloproteinases (TIMP‑1; Figure 1D).
Discussion
Although the design of our study did not enable us to directly infer about pathomechanisms, our results broadly agree with the up‑to‑date view of AP pathogenesis, underlining the role of neutrophil infiltration of the pancreas in the early phase of the disease. The actions of the infiltrating neutrophils, including degranulation, respiratory burst, production of chemokines and cytokines, and NETosis, have been associated with increased damage to pancreatic tissue, obstruction of the pancreatic duct by aggregated NETs, and increased activation of trypsinogen into trypsin.14 In animal models, depletion of neutrophils or inhibition of NETosis decreased early pancreatic injury.14 Moreover, in SAP, increased transmigration properties of neutrophils have been observed in line with their infiltration into remote organs, such as the lungs.14 Interestingly, our results showed early decrease (on day 2, as compared with the day of admission) in the concentrations of myeloperoxidase or histones in MAP, and their concomitant increase in SAP. There is accumulating evidence supporting the pathophysiological role of circulating histones in systemic inflammation and multiorgan failure in critically ill patients (including those with SAP).15 Recent studies have also suggested their potential as biomarkers of severity in patients with critical illness.15
Our results (Figure 1 and Supplementary material, Figure S1, Tables S4 and S5) are in line with previous studies showing positive associations of serum / plasma concentrations of acute‑phase markers, such as CRP (also supported by the routine laboratory tests performed during the hospital stay), pentraxin 3, serum amyloid A, and von Willebrand factor (vWF) with AP severity.16,17 Importantly, our results suggest several additional proteins (eg, S100‑A7, A8, and A9 proteins, VSIG4, tenascin, or chitinase‑3–like protein) as candidate markers for early (starting from the day of admission) classification of AP severity. Some of these proteins have already been specified in earlier studies (eg, plasma S100‑A8/A9 in AP of alcohol etiology,18 or exosome S100‑A8/A9 and their heterodimer calprotectin in SAP19); however, they have not been systematically studied in a particular clinical context. Others (VSIG4, tenascin, chitinase‑3–like protein) have been associated with inflammation but have not been studied in AP. In addition to their potential clinical usefulness, their involvement in AP pathomechanisms may also be of interest. Of note, the SAP to MAP fold change values obtained in our study for day 1 samples were consistently lower as compared with samples from day 2; moreover, in many cases, significant differences were observed only on day 2, or even changed the direction (as in the case of the S100A7 protein), highlighting the considerable difficulty in finding robust markers for early recognition of SAP and the fact that the time from the onset of symptoms should always be taken into account in the context of early‑phase AP.
Interestingly, our pathway enrichment analysis showed multiple alterations in IGF signaling in AP, in association with elevated serum TIMP‑1 levels. Although the altered IGF signaling has been well studied in other pancreatic diseases (including pancreatic cancer), it has not been extensively explored in AP. Our results showing increased serum TIMP‑1 levels in SAP are in line with previous findings regarding a variety of inflammatory diseases, including AP.20 Notably, recent evidence has underscored multiple functions of TIMP‑1 (including the association with neutrophil degranulation), showing that it should be considered a proinflammatory acute‑phase cytokine and may represent an important marker of disease severity and impaired tissue regeneration.20
We identified single published studies focusing on serum or plasma proteome in differentiating SAP and MAP.21,22 One additional study19 assessed exosomes isolated from plasma in that clinical context. The earliest study used gel electrophoresis and surface‑enhanced laser desorption / ionization time‑of‑flight mass spectrometry, which did not allow for identification of specific proteins. A study by Li et al22 used DIA‑based proteomics to identify 35 differently expressed proteins in 3 patients with SAP and 10 healthy controls, following immunochemical measurements of plasma concentrations of selected proteins in 83 patients with AP of various severity. The number of samples analyzed for the proteome representing SAP was smaller than in our study, which may explain the small number of candidate biomarkers identified.22 Some of the results were contradictory to established evidence17 (and to our results), for example, the observation of lower circulating vWF levels in SAP vs non‑SAP patients. Carrascal et al19 used liquid chromatography–mass spectrometry to analyze proteomes of exosomes isolated from patients with mild, moderate, and severe AP (n = 20 for each group) vs healthy controls. The study underscored proinflammatory properties of the exosomes isolated from plasma of the patients with AP in correlation with AP severity. In SAP, several acute‑phase proteins (eg, CRP, S100‑A8/A9, and vWF) were upregulated in the studied exosomes, which is in line with our findings.
The strength of our study is the use of serum samples obtained at well‑defined time intervals early in the course of the disease. The low number of samples studied and a lack of a validation set must be viewed as limitations. The study samples were collected in a real‑life clinical setting. The presence of comorbidities, despite an absence of significant differences between the studied subgroups, might have influenced the results.
In conclusion, our study enabled the identification of several novel candidate markers for early prediction of AP severity. The usefulness of these biomarkers should be evaluated in further studies.
- Li T, Qin C, Zhao B, et al. Global and regional burden of pancreatitis: epidemiological trends, risk factors, and projections to 2050 from the Global Burden of Disease study 2021. BMC Gastroenterol. 2024; 24: 398. | Crossref
- Tang M, Ning Y, An J, et al. Differences in cardiovascular outcomes between men and women with acute pancreatitis. Pol Arch Intern Med. 2024; 134: 16867. | Crossref
- Banks PA, Bollen TL, Dervenis C, et al. Classification of acute pancreatitis—2012: revision of the Atlanta classification and definitions by international consensus. Gut. 2013; 62: 102‑111. | Crossref
- Matta B, Gougol A, Gao X, et al. Worldwide variations in demographics, management, and outcomes of acute pancreatitis. Clin Gastroenterol Hepatol. 2020; 18: 1567‑1575. | Crossref
- Capurso G, Ponz de Leon Pisani R, Lauri G, et al. Clinical usefulness of scoring systems to predict severe acute pancreatitis: a systematic review and meta‑analysis with pre and post‑test probability assessment. United Eur Gastroenterol J. 2023; 11: 825‑836. | Crossref
SUPPLEMENTARY MATERIAL
ARTICLE INFORMATION