Thyroid function and autoimmunity in pregnancy: results of a longitudinal study on contributing factors and real-life performance of reference ranges recommended by the national guidelines
1 ,
Key words: pregnancy, thyroid autoimmunity, thyroid function, thyroid hormones
,
Key words: pregnancy, thyroid autoimmunity, thyroid function, thyroid hormones

 CC BY 4.0
Thyroid function and autoimmunity in pregnancy: results of a longitudinal study on contributing factors and real-life performance of reference ranges recommended by the national guidelines
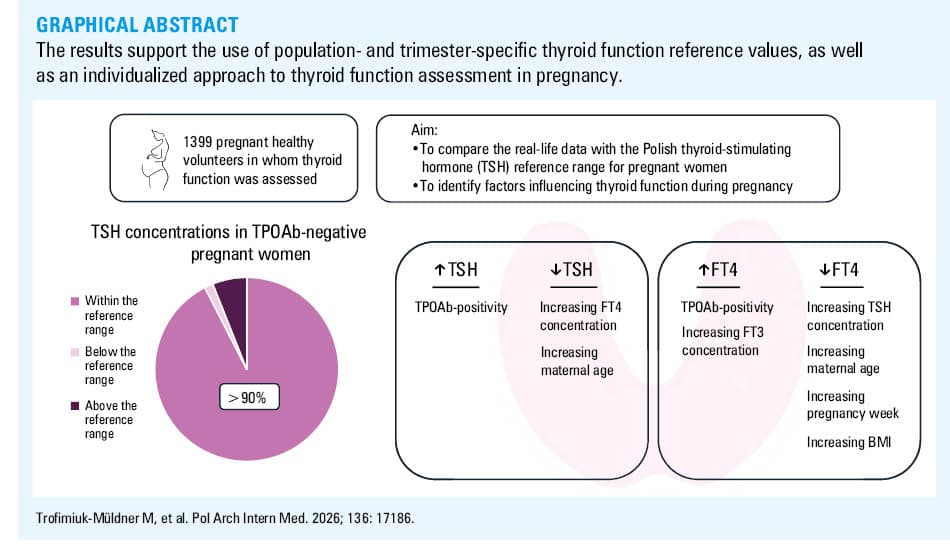
Introduction: Thyroid dysfunction and thyroid autoimmunity during pregnancy are linked to an increased risks of adverse maternal and fetal outcomes. Guidelines recommend population‑specific thyroid hormone reference ranges in pregnancy, though adherence and effectiveness vary.
Objectives: We aimed to evaluate the performance of thyroid function reference ranges recommended by Polish national guidelines in pregnancy and to assess clinical and demographic factors affecting thyroid hormone levels and autoimmunity.
Patients and methods: A cohort of 1339 pregnant women across all trimesters was recruited in Poland (2007–2017). Serum levels of thyroid‑stimulating hormone (TSH), free thyroxine (FT4), free triiodothyronine (FT3), and thyroid peroxidase antibodies (TPOAbs), and urinary iodine concentration (UIC) were measured. Associations between thyroid status and maternal age, body mass index (BMI), gestational age, and UIC were analyzed.
Results: Over 91% of the participants had TSH concentrations within Polish trimester‑specific reference ranges. TPOAbs were positive in 12% of the cases, and were strongly associated with higher TSH and lower FT4 concentrations (P <0.001). TSH level was negatively associated with FT4 concentrations and age (P <0.001), and positively with TPOAb (P <0.001). FT4 concentrations were positively associated with TPOAb (P = 0.04) and FT3 concentrations (P <0.001), but negatively influenced by trimester, TSH, age, BMI, and pregnancy week (P <0.001).
Conclusions: TPOAb presence correlated with elevated TSH concentrations and impaired FT4 response, which supported the role of TPOAb as a key marker in pregnancy screening. Maternal age and BMI significantly influenced FT4 levels, pointing at the new factors to be considered when interpreting thyroid function tests results. Our findings support current Polish reference ranges and emphasize the need for locally adapted criteria in thyroid management during pregnancy.
What's new?
This study uniquely correlates Polish gestational reference values for thyroid function with real‑life data from over 1300 pregnant women, one of the largest Polish cohorts reported to date. Findings support using flexible, locally derived thyroid‑stimulating hormone (TSH) reference values for clinical decision‑making, and question strict adherence to universal fixed thresholds. We also assessed factors influencing thyroid function in Polish pregnant women. Importantly, the results show that maternal age and body mass index independently influenced free thyroxine concentrations, while thyroid peroxidase antibodies positivity significantly correlated with higher TSH concentrations, emphasizing the need for tailored clinical evaluation rather than one‑size‑fits‑all thresholds.
Introduction
Thyroid hormones play a critical role in meeting the increased metabolic demands of early pregnancy, supporting placental development, and ensuring normal fetal growth and neurodevelopment.1
During gestation, profound physiological changes occur in thyroid function. They include increased concentrations of thyroxine‑binding globulin, enhanced degradation of thyroid hormones by placental type 3 deiodinase, and stimulation of the thyroid gland due to high concentrations of human chorionic gonadotropin (hCG).1,2
It is well established that overt maternal hypothyroidism is associated with a heightened risk of adverse obstetric outcomes, such as preterm birth and impaired child neurodevelopment.3-5 Although overt hypothyroidism in pregnancy is relatively rare, the reported prevalence of thyroid dysfunction, particularly subclinical hypothyroidism, ranges from 2.2% to 10% across different studies.6,7
Recent evidence indicates that even mild abnormalities in thyroid function tests are associated with an increased risk of adverse outcomes, such as pregnancy loss and placental abruption.6 Moreover, thyroid autoimmunity, particularly the presence of thyroid peroxidase antibodies (TPOAbs), is highly prevalent among women of reproductive age.8 TPOAb positivity has been associated with an elevated risk of adverse pregnancy outcomes affecting both the mother and the fetus or neonate, even in women with normal thyroid‑stimulating hormone (TSH) concentrations.9-11 Iodine deficiency, which plagues most European countries, poses a threat to fetal nervous system development, as stressed in the 2018 Kraków Declaration on Iodine—a final statement of a multinational EUthyroid Consortium working within the European Union Horizon 2020 program.12
These facts underline the importance of accurately diagnosing and managing thyroid abnormalities in pregnancy. Current guidelines from the American Thyroid Association (ATA) recommend using pregnancy‑specific reference ranges for TSH to interpret thyroid function tests in pregnant women.13 Historically, inconsistent diagnostic thresholds (eg, defining gestational hypothyroidism using TSH concentrations above 2.5, 3, or 4 mIU/l), have led to both under- and overtreatment worldwide.7
In 2017, trimester‑specific reference ranges for TSH and thyroid hormones14 were established in a prospective, multicenter study of healthy pregnant women in Poland. These values have since been incorporated into the updated guidelines of the Polish Society of Endocrinology (PSE) for managing thyroid disorders during pregnancy.15
Our study had 2 aims: 1) to evaluate real‑life performance of the gestational reference ranges for thyroid function recommended by the 2021 PSE guidelines,15 with particular emphasis on thyroid autoimmunity in pregnant women, and 2) to identify potential factors influencing thyroid function during pregnancy and compare them with findings of previous studies.
Patients and methods
Study group
The study was conducted between 2007 and 2017, as part of the Polish National Program for Elimination of Iodine Deficiency. It was carried out in 20 randomly selected towns and cities in Poland where at least 1 maternity ward is located. The participants were recruited via information received from maternity wards, obstetricians’ practices, and social media. The primary group included 1405 apparently healthy pregnant volunteers (based on self‑reported medical history, also negative for thyroid diseases diagnosed before pregnancy, including thyroid autoimmunity, and not taking medications affecting thyroid function). After exclusion of participants without TPOAb and urinary iodine concentration (UIC) measurements, 1339 women (median [IQR] age, 29 [26–33] y) were included for thyroid function analysis (n = 213 [16%] in the first trimester, n = 531 [40%] in the second trimester, and n = 595 [44%] in the third trimester of pregnancy; Figure 1).
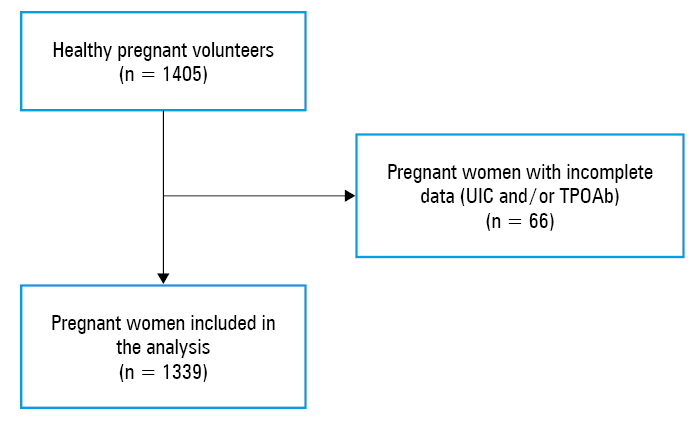
Abbreviations: UIC, urinary iodine concentration; TPOAb, thyroid peroxidase antibody
Written informed consent was obtained from each participant. The study was approved by the local Ethics Board of the Jagiellonian University (1072.61201.7.2017).
Patients and methods
Each participant was asked to fill in a questionnaire regarding maternal age, gestational age, the number of previous pregnancies and miscarriages, comorbidities, medication, and supplement use. Physical examination, including calculation of body mass index (BMI), was performed. Blood samples for TSH, free thyroxine (FT4), and TPOAb, as well as urine samples for UIC assessment were obtained from each volunteer. The blood samples for free triiodothyronine (FT3) concentration assessment were collected from 984 participants (68.56%). Samples of whole blood were collected into standard, no‑additive tubes, centrifuged at room temperature, and serum aliquots were pipetted into storage vials, frozen, and stored at –20 °C until measurements (usually within 7 days from blood retrieval). All blood samples were analyzed in the local Clinical Biochemistry Department with the ROCHE Cobas 6000/8000 platform by electrochemiluminescence (Roche Eclesys TSH assay; Roche Eclesys FT4 II assay, Roche Eclesys FT3 III assay, and Roche Eclesys TPOAb assays, for TSH, FT4, FT3, and TPOAb, respectively; Roche Diagnostics, Mannheim, Germany). The Clinical Biochemistry Department was certified by the Randox International Quality Assessment Scheme, the Unity Interlaboratory Comparison Program, the Sysmex International Quality Assurance System, and the StandLAB IQS. Quantification limits for TSH were 0.005–100 mIU/l, for FT3 0–50 pmol/l, for FT4 0–100 pmol/l, and for TPOAb 5–600 IU/ml. The reference ranges for thyroid hormone assays for nonpregnant adults were 0.3–4.5 mIU/l for TSH, 11–22 pmol/l for FT4, 3.1–6.8 pmol/l for FT3. TPOAb positivity was defined according to the manufacturer as TPOAb concentration above 34 mIU/l. UIC measurements were handled according to the World Health Organization (WHO)16 and the EUthyroid Consortium recommendations.17 UIC was measured in the spot morning urine sample provided by each participant, who were instructed to avoid the first‑morning void. Two milliliters of urine were transferred to urine tubes, frozen, and stored at –20 °C until analysis. UIC was measured after sample defrosting in the Sandell–Kolthoff reaction at the Medical Diagnostics Unit, Faculty of Pharmacy, Jagiellonian University Medical College, Kraków, Poland.18 The laboratory participated in the UIC accuracy testing program led by the National Institute of Health and Welfare, Helsinki, Finland, within the EUthyroid Consortium.
Statistical analysis
Statistical analysis was performed using R package, version 4.2.2 (R Core Team, 2022, Vienna, Austria). The ggplot2 package19 was used to create graphs. Numerical data are presented as mean (SD) or median (interquartile range [IQR]). Categorical variables are presented as counts and proportions. Analysis of variance (ANOVA), the Kruskal–Wallis, Pearson χ2, and exact Fisher tests were used for comparisons between groups, depending on data distribution. The statistical tests were performed with the lsmeans R package.20 All the compared parameters showed right‑skewed distribution; hence, the data were log‑transformed before calculations to achieve normality. A P value below 0.05 was considered significant.
To account for many related comparisons of interest, differences between the trimesters and TPOAb‑positive and negative groups were assessed using the Tukey honest significant difference tests for subgroup means from a 2‑way ANOVA model with interactions. While performing a comparison of yearly differences, the Kruskal–Wallis test was used, as standard ANOVA assumptions (checked with the Levene and Shapiro–Wilk tests) were not met.
To determine the factors influencing TSH and FT4 concentrations, multiple linear regression models were built. As data were missing on FT3 concentration and the week of pregnancy (31% and 20% of patients, respectively), we attempted to build an auxiliary regression model to impute the missing values (regression imputation approach) based on FT4 concentration, as other variables either showed little‑to‑no correlation to FT3 and pregnancy week or had missing values in the same patients. The imputed values were used in the model for predicting TSH concentration, but could not be used in the FT4 concentration model, as FT4 was already used for missing value imputation. Hence, the FT4 model uses a reduced dataset.
Results
The study group characteristics are summarized in Table 1. Concentrations of thyroid hormones and urinary iodine are presented in Table 2. Mean (SD) BMI at the start of pregnancy was 23.02 kg/m2 (3.81 kg/m2; 2.5–97.5 percentile range, 17.71–32.05 kg/m2). TPOAb positivity was observed in 12% of the study population, specifically in 18% (n = 38), 15% (n = 80), and 9% (n = 52) of pregnant women in the first, second, and third trimester, respectively (P <0.001). There was no significant difference in maternal age between the TPOAb‑positive and TPOAb‑negative women (P = 0.16). Mean (SD) TSH values in the TPOAb‑positive women were 1.64 (2.7), 1.88 (1.9>), and 1.59 (2.11) mIU/l, and in the TPOAb‑negative women they were 0.85 (3.36), 1.35 (2.52), 1.46 (2.2) mIU/l, in the first, second, and third trimester, respectively. We found substantial differences in mean TSH values between the TPOAb‑negative and TPOAb‑positive women in the first trimester (P <0.001), and in the second trimester (P = 0.004; Table 2, data expressed as medians are presented in Supplementary material, Table S1).
Parameter | Value, n (%) | |
a Data for 1073 women who had already been pregnant before | ||
Age, y | 16–20 | 44 (3.3) |
21–25 | 234 (17.5) | |
26–30 | 549 (41) | |
31–35 | 360 (26.9) | |
36–40 | 131 (9.8) | |
>40 | 21 (1.6) | |
Trimester | First | 213 (15.9) |
Second | 531 (39.7) | |
Third | 595 (44.4) | |
Number of pregnancies | 1 | 652 (48.7) |
2 | 424 (31.7) | |
3 and more | 260 (19.4) | |
Missing data | 3 (0.2) | |
Number of given births | 0 | 266 (19.9) |
1 | 622 (46.5) | |
2 | 317 (23.7) | |
3 and more | 134 (10) | |
Miscarriagesa | No | 948 (88.4) |
Yes | 125 (11.6) | |
Iodine supplementation | No | 509 (38) |
Yes | 829 (61.9) | |
Missing data | 1 (0.1) | |
Paramater | Value | Trimester | P value (mean difference of logarithms) | |||||
First | Second | Third | First vs second trimester | First vs third trimester | Second vs third trimester | |||
Abbreviations: FT3, free triiodothyronine; FT4, free thyroxine; TSH, thyroid‑stimulating hormone; others, see Figure 1 | ||||||||
FT3, pmol/l | Total | Mean (SD) | 5.19 (1.19) | 4.92 (1.23) | 4.37 (1.2) | 0.01 | <0.001 | <0.001 |
2.5–97.5 percentile | 4.07–7.39 | 3.57–7.83 | 3.2–7.04 | |||||
TPOAb‑positive | Mean (SD) | 5.09 (1.13) | 4.87 (1.18) | 4.39 (1.2) | 0.92 | 0.04 | 0.13 | |
2.5–97.5 percentile | 4.18–6.25 | 3.94–7.43 | 3.35–6.17 | |||||
TPOAb‑negative | Mean (SD) | 5.22 (1.2) | 4.93 (1.24) | 4.36 (1.2) | 0.08 | <0.001 | <0.001 | |
2.5–97.5 percentile | 4.04–7.63 | 3.51–7.89 | 3.21–7.04 | |||||
FT4, pmol/l | Total | Mean (SD) | 15.31 (1.17) | 12.59 (1.18) | 12 (1.2) | <0.001 | <0.001 | <0.001 |
2.5–97.5 percentile | 11.63–21.72 | 9.28–17.32 | 8.49–17.43 | |||||
TPOAb‑positive | Mean (SD) | 15.39 (1.15) | 12.62 (1.19) | 12.85 (1.22) | <0.001 | <0.001 | 0.99 | |
2.5–97.5 percentile | 11.86–20.19 | 9.06–17.39 | 9.18–19.62 | |||||
TPOAb‑negative | Mean (SD) | 15.3 (1.17) | 12.59 (1.17) | 11.92 (1.2) | <0.001 | <0.001 | <0.001 | |
2.5–97.5 percentile | 11.63–22.27 | 9.36–17.24 | 8.46–16.93 | |||||
TSH, mIU/l | Total | Mean (SD) | 1.42 (2.45) | 1.47 (2.19) | 0.96 (3.32) | <0.001 | <0.001 | >0.99 |
2.5–97.5 percentile | 0.18–4.46 | 0.35–4.33 | 0.03–4.03 | |||||
TPOAb- positive | Mean (SD) | 1.88 (1.9) | 1.59 (2.11) | 1.64 (2.7) | >0.99 | 0.98 | 0.74 | |
2.5–97.5 percentile | 0.5–4.86 | 0.35–6.71 | 0.19–4.6 | |||||
TPOAb‑negative | Mean (SD) | 1.35 (2.52) | 1.46 (2.2) | 0.85 (3.36) | <0.001 | <0.001 | 0.96 | |
2.5–97.5 percentile | 0.15–4.19 | 0.35–4.24 | 0.03–3.77 | |||||
UIC, µg/l | Total | Mean (SD) | 81.6 (2.08) | 95.54 (1.98) | 91.31 (2.29) | 0.03 | 0.14 | 0.61 |
2.5–97.5 percentile | 15.87–286.59 | 22.71–306.9 | 11.43–421.45 | |||||
TPOAb- positive | Mean (SD) | 85.13 (2.02) | 93.75 (1.89) | 87.51 (2.62) | 0.99 | >0.99 | >0.99 | |
2.5–97.5 percentile | 25.53–309.75 | 31.85–252.65 | 10.82–394.87 | |||||
TPOAb- negative | Mean (SD) | 80.85 (2.09) | 95.87 (2) | 91.68 (2.26) | 0.12 | 0.38 | 0.95 | |
2.5–97.5 percentile | 13.71–276.92 | 22.14–306.9 | 12.13–423.76 | |||||
Mean (SD) FT4 values in the TPOAb‑positive women were 15.39 (1.5), 12.62 (1.19), and 12.85 (1.22) pmol/l, as compared with 15.3 (1.17), 12.59 (1.17), and 11.92 (1.2) pmol/l in the TPOAb‑negative women in the first, second, and third trimester, respectively. We found a considerable difference in FT4 concentrations between the TPOAb‑positive and TPOAb‑negative women in the third trimester (P = 0.01; Table 2, data expressed as medians are presented in Supplementary material, Table S1). Mean (SD) FT3 values in the TPOAb‑positive women were 5.09 (1.22), 4.87 (1.18), and 4.39 (1.2) pmol/l, and in the TPOAb‑negative women they were 5.22 (1.2), 4.93 (1.24), and 4.36 (1.2) pmol/l, respectively, throughout pregnancy. No significant differences in FT3 concentrations were observed between the 2 groups (Table 2, data expressed as medians are presented in Supplementary material, Table S1).
Mean UIC values were higher in the TPOAb‑positive than the TPOAb‑negative women in the first and third trimester; however, the differences were not significant (Table 2, data expressed as medians are presented in Supplementary material, Table S1). The entire study group could be classified as iodine‑deficient, with median (IQR) UIC of 93.98 (61.94–147.1) µg/l. Notably, 16.6% of the participants (222 out of 1339) had UIC concentrations below 50 µg/l.
Iodine supplementation impacted thyroid test results (Supplementary material, Table S2). In the women taking iodine‑containing supplements, mean TSH concentration was slightly higher in the first trimester (P = 0.046), mean FT4 level was lower in the first (P = 0.003) and third (P = 0.03) trimester, and mean FT3 level was significantly lower in all trimesters of pregnancy (P = 0.008, P = 0.042, and P = 0.009, in the first, second, and third trimester, respectively), as compared with the women not taking iodine‑containing supplements. Mean (SD) UIC was higher in the women taking vs not taking iodine‑containing supplements, both in the whole study group (128.54 [93.7] µg/l vs 101.48 [88.55] µg/l; P <0.001), and in each trimester of pregnancy (Supplementary material, Table S3).
Comparison of the thyroid‑stimulating hormone concentrations
Data on the patients with moderately high (≥2.5 mIU/l) and high (≥4 mIU/l) TSH levels are presented in Table 3. The prevalence of high TSH concentrations (≥4 mIU/l) was greater in the TPOAb‑positive pregnant women than those who were TPOAb‑negative in all 3 trimesters (P = 0.01 only for the second trimester).
Trimester | TPOAb status | Number of women according to TSH concentration | P valuea | Number of women according to TSH concentration | P valueb | ||
<2.5 mIU/l | ≥2.5 mIU/l | <4 mIU/l | ≥4 mIU/l | ||||
a P values calculated with the χ2 test
b P values calculated with the Fisher exact test
| |||||||
First | TPOAb‑negative | 152 | 23 | <0.001 | 172 | 3 | 0.07 |
TPOAb‑positive | 23 | 15 | 35 | 3 | |||
Second | TPOAb‑negative | 360 | 91 | 0.01 | 437 | 14 | 0.01 |
TPOAb‑positive | 53 | 27 | 72 | 8 | |||
Third | TPOAb‑negative | 448 | 95 | 0.14 | 522 | 21 | 0.26 |
TPOAb‑positive | 38 | 14 | 48 | 4 | |||
Comparison with the reference ranges established for the Polish population of pregnant women
In the first trimester, 91.08% of the participants (194 out of 213) had TSH concentrations within the reference range. In the second trimester, 91.15% of the participants (484 out of 531) had TSH concentrations within the reference range. Lastly, in the third trimester, this group included 92.94% of the patients (553 out of 595). The percentage of patients with TSH within the reference range remained consistently high throughout pregnancy (Supplementary material, Figure S1). Although the study was conducted between 2007 and 2017, no significant yearly differences in TSH concentrations were noted.
Factors influencing thyroid‑stimulating hormone and free thyroxine concentrations
TSH concentration (Table 4) was negatively affected by FT4 level and participant age (P <0.001 for both). A positive effect was found for TPOAb (P <0.001), but not for UIC (P = 0.06).
Parameter | Coefficient | SE | t(1055) | P value |
R‑2, 12.6%; adjusted R‑2, 11.92%; RMSE, 1.1115; MAE, 0.8181
| ||||
Intercept | 3.9277 | 0.4076 | 9.6359 | <0.001 |
TPOAb, IU/l | 0.0038 | 0.0005 | 7.9278 | <0.001 |
UIC, µg/l | 0.0003 | 0.0004 | 0.6905 | 0.49 |
FT4, pmol/l | –0.1031 | 0.0168 | –6.1427 | <0.001 |
Age, y | –0.0368 | 0.0070 | –5.2345 | <0.001 |
Pregnancy week | 0.0041 | 0.0044 | 0.9276 | 0.35 |
BMI, kg/m2 | 0.0001 | 0.0090 | 0.0061 | >0.99 |
We did not find a significant difference in TSH concentrations between the women with normal weight, overweight, and obese ones (P = 0.69; Supplementary material, Figure S2).
FT4 concentration (Table 5) was positively affected by TPOAb (P = 0.04) and FT3 (P <0.001), and negative effects were detected for TSH (P <0.001), age (P <0.001), BMI, and pregnancy week (P <0.001).
Parameter | Coefficient | SE | t(899) | P value |
R‑2, 30.13%; adjusted R‑2, 29.58%; RMSE, 1.9511; MAE, 1.4983
| ||||
Intercept | 17.2682 | 0.6664 | 25.9123 | <0.001 |
TSH, mIU/l | –0.318 | 0.0576 | –5.5237 | <0.001 |
TPOAb, IU/l | 0.0018 | 0.001 | 1.8083 | 0.07 |
UIC, µg/l | 0.0008 | 0.0009 | 0.9584 | 0.34 |
FT3, pmol/l | 0.2477 | 0.0658 | 3.7623 | <0.001 |
Age, y | –0.046 | 0.0136 | –3.3727 | <0.001 |
Pregnancy week | –0.1116 | 0.0079 | –14.1067 | <0.001 |
BMI, kg/m2 | –0.0772 | 0.0179 | –4.3167 | <0.001 |
Discussion
Thyroid hormones play a crucial role in regulating metabolism, growth, and development of the fetus. Thyroid dysfunction during pregnancy may influence the progression of pregnancy and is associated with complications in both the mother and the developing fetus.1 Hypothyroidism, for example, may increase the risk of fetal growth retardation, neurologic deficits, preterm birth, as well as pregnancy‑induced hypertension and maternal postpartum complications.3,4,21,22 Therefore, accurate identification and careful management of thyroid disorders during pregnancy are crucial.
It is generally recommended to apply the pregnancy‑specific TSH reference ranges while interpreting thyroid test results in pregnant women. Until the 1990s and early 2000s, reference ranges for TSH in pregnancy were not clearly defined, and the reference values for the general population were often used. Since the groundbreaking study by Glinoer et al,23 it has been recognized that high hCG concentrations in early pregnancy cause a downward shift in maternal TSH. This phenomenon was accounted for when establishing the first guidelines for managing thyroid dysfunction in pregnancy (Table 6). It was advised to use the local reference range for thyroid function tests, and if not feasible, the early guidelines recommended applying a lower limit than the general population’s upper reference range for TSH.
Association / authority | Year | Key findings | Recommended TSH reference range |
National Academy of Clinical Biochemistry (NACB)56 | 2005 | The upper limit of normal TSH in the first trimester should be approximately 2.5 mIU/l. Emphasized the need for population- and method‑specific reference intervals, refined by strict selection criteria including normal thyroid ultrasound results. | First trimester, approximately 2.5 mIU/l (upper limit), no specific reference for the second / third trimester |
Endocrine Society57 | 2007 | Recommended maintaining TSH <2.5 mIU/l in the first, and <3 mIU/l in the second and third trimester in hypothyroid pregnant patients. Reinforced trimester‑specific management strategies. | First trimester <2.5 mIU/l, second and third trimester <3 mIU/l |
American Thyroid Association58 | 2011 | Defined that the upper limit of TSH in pregnancy should be 2.5 mIU/l in the first trimester and 3 mIU/l in the second and third trimester. Recommended establishing local, trimester‑specific reference ranges but suggested the above values in the absence of such data. | First trimester, 0.1–2.5 mIU/l;
Second trimester, 0.2–3 mIU/l;
Third trimester, 0.3–3 mIU/l |
Polish Society of Endocrinology and Polish Society of Gynecology joint guideline31 | 2011 | Trimester‑specific reference for a given population and diagnostic facility recommended. If absent, upper limit of TSH of 2.5 mIU/l throughout pregnancy should be applied (it was expected that the upper limit of TSH would be decreased to 2 mIU/l). | Upper limit, 2.5 mIU/l |
European Thyroid Association59 | 2014 | Supported the use of trimester‑specific TSH reference ranges and noted that inappropriate reference ranges may lead to overdiagnosis of thyroid dysfunction in pregnancy. | First trimester, 0.1–2.5 mIU/l;
Second trimester, 0.2–3 mIU/l;
Third trimester, 0.3–3.5 mIU/l |
American Thyroid Association13 | 2017 | Proposed a more liberal approach, suggesting the upper TSH limit could be around 4 mIU/l in early pregnancy if population‑specific ranges are unavailable.
When possible, population‑based, trimester‑specific reference ranges for serum TSH should be defined through assessment of local population data representative of a health care provider’s practice. Reference range determinations should only include pregnant women with no known thyroid disease, optimal iodine intake, and negative TPOAb status. | First trimester, approximately 4 mIU/l (if no local reference available), second and third trimester, gradual return to nonpregnant range |
Polish Society of Endocrinology15 | 2021 | Trimester‑specific reference ranges established on the basis of studies in the Polish population (preferably for a given laboratory) are recommended. If not available, reference ranges from multicenter Polish prospective study might be applied. | ECL assays:
First trimester, 0.009–3.18 mIU/l;
Second trimester, 0.05–3.44 mIU/l;
Third trimester, 0.11–3.53 mIU/l |
Royal College of Obstetricians and Gynaecologists60 | 2025 | References should be derived from a population with similar iodine status and family origin to the population to which they are being applied, and the laboratory should provide these.
Where trimester- and manufacturer‑specific pregnancy reference ranges are not issued by the laboratory, the published thyroid function reference ranges in pregnancy for the specific assay manufacturer may be applied. | Depending on manufacturer and platform (Abbott Architect; Beckman Access / Dxl; Roche Cobas / Eclesys; Siemens Advia Centaur) – upper range
First trimester, 3.32–4.1 mIU/l;
Second trimester, 3.31–4.46 mIU/l;
Third trimester, 4.34–5.02 mIU/l |
Since the late 2000s, a growing number of studies have highlighted that employing strict, fixed cutoff values for thyroid function tests during pregnancy can lead to reclassification of thyroid status in a significant proportion of women and overdiagnosis of thyroid dysfunction in pregnancy, potentially affecting treatment decisions. Korevaar et al24 raised concerns about the use of fixed TSH cutoff values, such as below 2.5 or 3 mIU/l, during pregnancy. The authors emphasized that fixed limits fail to reflect the dynamic physiological changes in thyroid function across gestation, potentially resulting in unnecessary levothyroxine treatment and unwarranted medicalization of otherwise healthy pregnancies. For instance, a study conducted in South Korea reported that applying a fixed TSH cutoff of below 2.5 mIU/l throughout the first trimester resulted in varying diagnosis rates of subclinical hypothyroidism depending on gestational age, that is, 25% at 3–6 weeks, 13% at 7 weeks, and 9% at 8–13 weeks. In contrast, using local gestational week–specific reference ranges allowed for maintaining a consistent diagnosis rate of approximately 5% across all gestational ages.25 Such a strategy, however, might be hard to apply in everyday practice.
On the other hand, applying the upper TSH cutoff values similar to the general population (4 mIU/l) may result in overlooking a mild thyroid dysfunction in early gestation. Nepalese researchers confirmed that population‑based, pregnancy‑specific reference intervals for TSH and FT4 identified more women requiring treatment than standard nonpregnancy reference ranges, underscoring the importance of tailored reference intervals during pregnancy.26 In their study, applying local reference ranges doubled the number of pregnant women who needed medical intervention (the incidence increased by 0.9% of the studied population). Similar conclusions were drawn from the analysis of the Consortium on Thyroid and Pregnancy data,27 comprising over 52 000 participants from 18 cohorts. The authors concluded that alternative approaches to population- and trimester‑specific reference intervals, such as the fixed upper TSH limit of 4 mIU/l, a fixed subtraction of 0.5 mIU/l from the upper limit for TSH, and using nonpregnancy reference values, result in considerable over- or underdiagnosis of thyroid dysfunction during gestation.
In 2017, reference values for TSH and thyroid hormones in healthy pregnant women in Poland were established in a prospective, multicenter study.14 The study included 172 consecutive, healthy, TPOAb‑negative pregnant women. The upper reference limit for TSH in the first trimester (3.177 mIU/l) reported in the Polish study was higher than the threshold recommended by the 2014 European Thyroid Association (ETA) guidelines. These findings are comparable to those previously observed in other European populations,28 yet lower than the values reported in India (5.78 mIU/l).29 Only in Spain were the locally established reference ranges similar to those proposed by the 2014 ETA guidelines (2.65 mIU/l).30
In the updated PSE guidelines15 for thyroid diseases in pregnancy, these findings were proposed as reference values for TSH when thyroid hormone concentrations are measured using electrochemiluminescence. It is worth stressing the upward shift in the upper TSH normal range when compared with the first national guideline published in 2011.31 In our study, only 7.5% of women in the first trimester had TSH concentrations exceeding the upper reference limit of the Polish reference value (3.177 mIU/l). In contrast, applying the stricter ATA 2011 guidelines (TSH <2.5 mIU/l in the first trimester and <3 mIU/l in the second and third trimesters) would have resulted in hypothyroidism diagnosis in 16.9%, 12.6%, and 9.6% of patients in the first, second, and third trimester, respectively.
The differences in region‑specific reference ranges may be caused by divergence in geophysical environment, cultural habits (including diet), ethnicity, implementation and model of iodine prophylaxis, and other unique population features.
BMI and maternal age are additional factors that may influence thyroid function during pregnancy. However, the relationship between BMI and TSH remains unclear. For instance, Croce et al32 studied 2268 pregnant women without thyroid autoimmunity and found a significant association between higher BMI and elevated TSH concentrations in the first trimester. Obese women (BMI >30 kg/m²) had higher median TSH concentrations (1.8 mIU/l) than women with normal weight (1.6 mIU/l), and the likelihood of having TSH level equal to or above 4 mIU/l increased with growing BMI, regardless of confounding factors, such as smoking or family history of thyroid disorders. In contrast, Haddow et al33 reported no such association in a larger cohort of 9351 pregnant women. Similarly, our analysis did not reveal a significant correlation between BMI and TSH in the regression model.
Interestingly, we observed a negative correlation between BMI and FT4, which aligns with previous findings by Pop et al34 who demonstrated that higher BMI was associated with lower FT4 concentrations throughout pregnancy in healthy white Dutch women. Similarly, in a large cross‑sectional study of 54 586 pregnancies, prepregnancy overweight (adjusted odds ratio [OR], approximately 1.28–1.55) and obesity (adjusted OR, approximately 1.21–1.35) were independent risk factors for isolated hypothyroxinemia, with the effect most pronounced in the first trimester.35
Maternal age may act as a confounding variable affecting TSH concentrations, as these tend to rise with increasing age. Pearce et al36 reported that in pregnant women, TSH concentrations rose by approximately 0.03 mIU/l per year of maternal age (P = 0.03). In our analysis, maternal age showed a positive correlation with TSH concentrations and a negative correlation with FT4 concentrations, indicating that advancing age may predispose pregnant women to a higher risk of hypothyroidism. However, in a large cohort study involving 5223 pregnant women, Potlukova et al37 found that the age of 30 years or greater was not an independent risk factor for hypothyroidism or autoimmune thyroid disease. Nonetheless, incorporating the age of 30 years of greater into a case‑finding screening strategy substantially improved detection rates, identifying 85.6% of hypothyroid cases vs just 55.3% when using traditional risk factors alone.
Reference values for TSH should be established for iodine‑sufficient populations.13 However, this is often not feasible, as pregnant women frequently remain iodine insufficient even in regions where iodine deficiency has been eliminated in the general population—such as in Poland.
Interestingly, in our study, UIC was not found to be a significant risk factor for elevated TSH concentrations. In the multivariable regression model, the association between UIC and TSH approached but did not reach significance (P = 0.06).
Since 1997, Poland has been classified as an iodine‑sufficient country, following the introduction of a national iodine prophylaxis program based on mandatory iodization of household salt. This strategy led to a substantial increase in iodine intake across the general population, confirming adequate iodine status at the national level.38 However, research by Trofimiuk‑Müldner et al39 and Zygmunt et al40 has shown that this approach does not ensure sufficient iodine intake for pregnant and lactating women. As a result, iodine supplementation remains essential for these groups to meet their increased physiological needs. It should be remembered that iodine‑containing supplements are taken on a voluntary basis. The adherence of Polish pregnant women to the recommended supplementation strategies (as in our group) was and still is low,41-43 and even women who declare regular intake of the recommended iodine‑enriched formulas fail to reach iodine sufficiency status.43
The presence of TPOAbs in pregnant women is associated with an increased risk of developing thyroid dysfunction.44-46 However, even in the absence of abnormal TSH concentrations, TPOAb positivity may be a risk factor of adverse pregnancy outcomes, such as hypertension, gestational diabetes, and adverse fetal‑neonatal outcomes.9-11 In this study, the prevalence of TPOAb positivity was 12%, which is higher than reported in a similar study conducted in Nepal,26 and exceeds the 10% prevalence observed in a large‑scale study from China.47
In our study, mean TSH concentration in the TPOAb‑negative group during the first trimester was significantly lower than in the TPOAb‑positive group. Moreover, 93.7% of the TPOAb‑negative women had TSH level in the first trimester within the Polish reference range (0.009–3.177 mIU/l), in contrast with only 78.9% of the TPOAb‑positive women. A similar pattern was observed in the second trimester (Supplementary material, Figure S1).
Furthermore, TPOAb positivity was a significant positive predictor of TSH concentrations in our regression model, reinforcing the role of thyroid autoimmunity in increasing TSH concentrations. These findings are consistent with a previous study by Bhattacharyya et al,48 which also reported higher TSH concentrations in TPOAb‑positive patients during early pregnancy.
We observed that FT4 concentrations in the first trimester were similar in the TPOAb‑positive and TPOAb‑negative women, albeit TPOAb‑positive participants exhibited significantly higher FT4 concentrations in the third trimester. These observations align with data from a Chinese study by Yang et al.47
A reduced thyroidal response to hCG in TPOAb‑positive pregnant women may play a role in this phenomenon. During early pregnancy, rising hCG concentrations stimulate the TSH receptor, resulting in an increase in FT4 levels. By the third trimester, FT4 concentrations typically decline in healthy pregnancies due to the diminishing influence of hCG.2 However, in TPOAb‑positive women, this hCG‑mediated stimulation of the thyroid is impaired; therefore, these women do not exhibit the expected rise in FT4 during the first trimester, nor is there a significant FT4 decline later in pregnancy. The absence of FT4 level elevation also prevents the usual TSH suppression through negative feedback. These observations are consistent with earlier studies, which have shown that TPOAb‑positive women exhibit a blunted FT4 response and less pronounced TSH suppression in response to hCG stimulation.47,49
It is recommended (according to the 2017 ATA guidelines) to use the data from the TPOAb‑negative population for establishing local reference ranges for trimester‑specific TSH values.
Osinga et al,50 in a systematic review and meta‑analysis of the Consortium on Pregnancy and Thyroid individual participant data, proved that thyroid function reference intervals during pregnancy are significantly influenced by methodological choices, particularly the exclusion of TPOAb‑positive individuals and the percentile range used to define the reference limits. A meta‑analysis, comprising 22 cohorts and 63 198 participants, demonstrated that not excluding TPOAb‑positive individuals led to a notable increase in the upper reference limit for TSH, particularly in the first trimester (+0.65 mIU/l).
Interestingly, although in our study a significant difference was observed in mean TSH concentrations during the first trimester between the TPOAb‑negative and TPOAb‑positive subgroups, the mean (SD) TSH concentration in the TPOAb‑negative group in the first trimester was nearly identical to that of the total study group population (0.85 [3.36] vs 0.96 [3.32] mIU/l). Notably, both mean values (Table 2) remained well below the upper reference limit of 3.177 mIU/l, which is the threshold for considering levothyroxine treatment at the onset of pregnancy. Therefore, in our case, excluding TPOAb‑positive patients when establishing reference ranges would likely have minimal clinical impact. Our findings support the recommendation for TPOAb screening in pregnancy with elevated TSH values. However, based on our findings, we do not support the use of separate reference ranges for TSH in TPOAb‑positive women during pregnancy.
The significant decrease in the TPOAb positivity rate with the progress of pregnancy, observed in our study group, has already been reported.51 As the mother must maintain immune tolerance of the fetal unit without compromising her own immune system response to infections, a switch toward a Th2‑type cytokine profile is observed, and improvement in Th1/Th17 autoimmune disorders (such as Hashimoto thyroiditis) is noted.52
Limitations
Due to a single study visit, we lack information regarding pregnancy outcomes. Moreover, our study was based on strictly defined parameters, such as thyroid hormone concentrations and BMI, which were measured only once at the time of recruitment. As is the case of most studies evaluating thyroid function during pregnancy, we did not assess concentrations of thyroxine‑binding globulin, albumin, or other serum proteins. This omission may have affected the accuracy of FT4 measurements.53 Commonly used FT4 assays—such as analogue immunoassays—are sensitive to alterations in protein binding and may yield inaccurate results.54 The lack of antithyroglobulin antibody assessment in the study group is another limiting factor, potentially leading to underestimated prevalence of thyroid autoimmunity and affecting interpretation of thyroid function tests.
Assessing iodine status by UIC in a single urine spot sample, although recommended by the WHO,16 has important limitations. UIC reflects only recent iodine intake and shows substantial intraindividual day‑to‑day and diurnal variability, so it cannot reliably classify an individual’s iodine status. Hemodilution and pregnancy‑related changes in renal physiology (eg, increased glomerular filtration) influence UIC. Correction for creatinine (urine iodine to creatinine index) may partially mitigate this, but is also prone to bias related to, among others, muscle mass.55
Conclusions
In our study, TPOAb positivity was significantly associated with higher TSH concentrations throughout pregnancy and a disrupted FT4 response to hCG stimulation. Consistent with existing data, our analysis did not demonstrate a significant association between BMI and TSH concentrations. Negative correlation of BMI with FT4 suggests that increased adiposity may influence thyroid hormone availability during pregnancy. Maternal age showed a positive correlation with TSH and a negative correlation with FT4 levels, indicating that advanced age may impact thyroid function and could enhance effectiveness of targeted screening strategies.
Our findings support the current Polish recommendations15 for the management of hypothyroidism during pregnancy.
We recommend considering a more flexible approach when selecting reference populations for establishing local TSH norms. In some countries, identifying a sufficient number of iodine‑replete control groups may pose a challenge. Therefore, strict adherence to narrow criteria could limit feasibility and representativeness of reference ranges. Adopting a more adaptable selection strategy could enhance the development of relevant and practical thyroid function benchmarks tailored to local populations.
- Lazarus JH. Thyroid function in pregnancy. Br Med Bull. 2011; 97: 137‑148. | Crossref
- Moleti M, Trimarchi F, Vermiglio F. Thyroid physiology in pregnancy. Endocr Pract. 2014; 20: 589‑596. | Crossref
- Willoughby KA, McAndrews MP, Rovet JF. Effects of maternal hypothyroidism on offspring hippocampus and memory. Thyroid. 2014; 24: 576‑584. | Crossref
- Korevaar TIM, Muetzel R, Medici M, et al. Association of maternal thyroid function during early pregnancy with offspring IQ and brain morphology in childhood: a population‑based prospective cohort study. Lancet Diabetes Endocrinol. 2016; 4: 35‑43. | Crossref
- Vamja R, M Y, Patel M, et al. Impact of maternal thyroid dysfunction on fetal and maternal outcomes in pregnancy: a prospective cohort study. Clin Diabetes Endocrinol. 2024; 10: 50. | Crossref
SUPPLEMENTARY MATERIAL
ARTICLE INFORMATION