
Multiple sclerosis in patients with rheumatoid arthritis: a nationwide, pilot study from Poland based on health care claims (2009–2021)
Key words: comorbidity, epidemiology, multiple sclerosis, Poland, rheumatoid arthritis

 CC BY 4.0
Multiple sclerosis in patients with rheumatoid arthritis: a nationwide, pilot study from Poland based on health care claims (2009–2021)
CC BY 4.0
Introduction: Multiple sclerosis (MS) and rheumatoid arthritis (RA) are common, chronic immune‑mediated diseases that share pathogenetic pathways, but their epidemiologic relationship is uncertain.
Objectives: We aimed to describe the association between MS and RA in the Polish population.
Patients and methods: This pilot, nationwide study was based on administrative health care claims sourced from the Polish National Health Fund (NHF). Between 2009 and 2021, MS and RA cases were identified through a combination of the International Classification of Diseases, Tenth Revision claims, in conjunction with the Anatomical Therapeutic Chemical codes for medications or drug program records. Annual prevalence and incidence trends were assessed. Within the study timeframe, a retrospective cohort of RA patients and a general population–based comparator were recruited, with year‑by‑year assessment of MS burden. The controls were matched 1:1 for age, sex, and calendar year of RA diagnoses, from individuals with any NHF contact in the corresponding year.
Results: In the years 2009–2021, 464 cases of concurrent MS were identified among patients with RA, whereas 813 MS cases were found in the matched control group (n = 307 519 per group). While the overall population trends suggest increased MS prevalence, annual incidence declined (P <0.001 for both RA and control), in combination with increasing age at MS diagnosis. Age- and serotype‑specific analyses suggested that young (16–39 y) women with RA had higher MS prevalence (37.2 vs 26.9 per 10 000 patients; prevalence ratio, 1.39; 95% CI, 1–1.92; P = 0.048) than the controls. Conversely, older women with RA showed significantly lower MS prevalence rates. Mortality was comparable in both groups.
Conclusions: Overall, RA was not associated with an increased overall MS risk, as compared with the general population. Young women with seronegative RA may be at a greater risk of MS, which warrants clarification of age, sex, and serotype‑specific risk disparities in future prospective longitudinal studies. However, clinical vigilance for atypical MS symptoms in young women with RA should be maintained.
What's new?
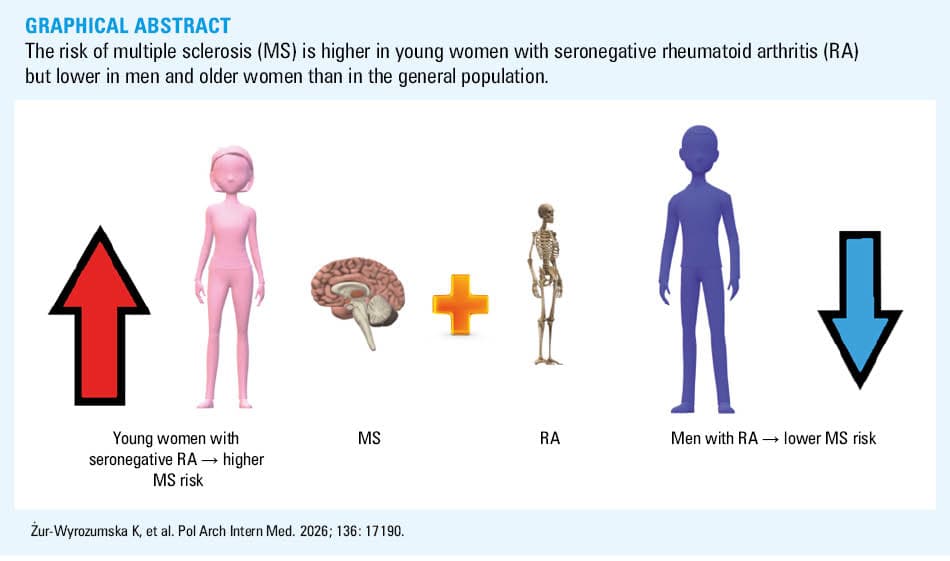
This is the first pilot study from Poland that aimed to characterize the relationship between multiple sclerosis (MS) and rheumatoid arthritis (RA) based on administrative health care claims from the National Health Fund. Generally, we observed higher MS prevalence in young women with seronegative RA, in contrast to older women and men with RA, among whom the rates tended to be lower, as compared with the general population–based controls. These age-, sex-, and serotype‑specific differences could reflect immunological interactions that shape individual susceptibility to RA and MS development. Our study highlights the need for further research into clinical, behavioral, and environmental factors influencing autoimmune disease risk, particularly among younger women with RA. Investigation of potential protective mechanisms in older age groups is also of interest. Our findings raise important questions about shared pathophysiological relationships, requirement for screening strategies, and diagnostic pathways.
Introduction
Rheumatoid arthritis (RA) and multiple sclerosis (MS) are chronic autoimmune diseases characterized by dysregulated immune responses. In RA, synovial inflammation and joint destruction are considered to be primarily mediated by Th1 and Th17 cells.1,2 Similarly, MS involves immune‑mediated damage to the central nervous system, with Th1 and Th17 cell subsets identified as drivers of neuroinflammation and blood–brain barrier disruption.3-5 Both autoimmune diseases share some overlapping inflammatory pathways and genetic susceptibility risk factors.5-7 Moreover, RA and MS are also linked to other inflammatory disorders, such as endometriosis or type 2 diabetes mellitus, which suggests a broad pathophysiological network of immune dysregulation.8,9
Environmental and lifestyle factors are thought to influence both RA and MS prevalence. Among multiple risk factors, smoking has been identified as a major culprit in both RA and MS development, though this habit is insufficient to explain the risk association alone.10,11 Additional mechanisms, such as the role of premature cellular immunosenescence and pathogenic exposure (eg, due to periodontitis or viral infections, both of which can lead to citrullination of autoproteins), may explain the previously reported positive risk association between RA and MS.12-14 A shared background of genetic predisposition to autoimmunity could further explain the heterogenous risk profile for multiorgan disorders.7,15 However, the association between RA and MS remains inconsistent across studies,10,11,16,17 with no relationship observed between anticyclic citrullinated peptide (CCP) antibodies and MS presence.14
To investigate the risk of concurrent MS‑RA, we conducted a pilot study using administrative health care records from the Polish National Health Fund (NHF). We aimed to describe the population‑level association between RA and MS in comparison with the general population–based control group, including subgroup analyses by age, sex, and RA serotype.
Patients and methods
Study design and data source
This pilot, retrospective, population‑based cohort study was conducted using administrative health care claims from the NHF. Additionally, cross‑sectional assessment of MS burden in the Polish population was performed. Currently, there is no dedicated national registry for patients with RA or MS in Poland. The NHF is the only public health care payer, with coverage of various medical services across numerous hospitals, outpatient clinics, and medical centers holding a reimbursement contract. The NHF payment depends on patient employment and citizenship status, with minor exceptions. The role of the private sector in Poland is limited, in that it is highly unlikely for individuals to hold no record of public health care contact, particularly in the context of chronic diseases.18-20 To maintain consistency in the timeframe of exposure, unique patient identifiers were cross‑referenced with the death register maintained by the Ministry of Digitital Affairs of Poland. Due to the administrative nature of the data (personal identification number [PESEL] linkage for all citizens), incomplete or inaccurate (but not missing) data represent the major source of bias.
This report covers all persons over 16 years old that could be identified using PESEL codes within the NHF database from January 1, 2009, to December 31, 2021. As the observation began in 2009, left truncation limited assessment of the disease onset before electronic database inception. Therefore, our analyses were reported with a look‑back (so‑called “wash‑in”) period between 2009 and 2010, with analyses of aggregated data from January 1, 2011. Patients were progressively identified throughout the study timeframe, with cohort size changing over time. The maximum follow‑up window was 13 years.
We report 3 main analyses based on annual cross‑sectional datasets: 1) changes in annual period prevalence of MS among RA patients and general population–based controls (2011–2021); 2) changes in the number of newly detected MS cases (annual incidence) in both groups (2011–2021); and 3) cumulative prevalence comparison of MS between the RA and matched control groups, stratified by sex, age, and RA serotype.
For the two temporal analyses (prevalence and incidence), annual estimates were calculated using the number of individuals registered as alive and insured in the NHF at mid‑year as the denominator for each study group. For prevalence, the numerator was the number of individuals fulfilling the MS case definition in a given calendar year. For incidence, the numerator was the number of individuals meeting the MS case definition for the first time in that calendar year.
Of note, our study describes living individuals who met the case definitions at a given follow‑up time. Differences in survival may lead to competing risk and surveillance bias. Therefore, we analyzed mortality rates in both RA and control groups. To some extent (likely limited), postdiagnosis survival rates do not capture undetected cases (eg, due to real‑life diagnostic errors, or limitations of the chosen case definition) and premature deaths. Pragmatically, the prevalence estimates in older patient groups are most likely to be affected by surveillance bias, though given the cumulative approach to case identification, the distribution of bias should be (relatively) uniform. Nevertheless, our estimates should be treated conservatively.
Case identification
The patients with MS were identified based on NHF claims if, within any 3 consecutive years, they had at least 3 health care encounters coded with the International Classification of Diseases, Tenth Revision (ICD‑10) G35 code (ie, outpatient specialist visits, inpatient admissions, or use of rehabilitation services). However, at least 1 of these encounters was required to occur in a neurology setting. Participation in a dedicated MS drug program was treated as equivalent to fulfilling the latter criterion. It also represents 1 of the 3 required health care contacts, rather than an additional requirement. Disease onset was ascertained based on the date of the earliest fulfillment of the case definition criteria.
Due to the secondary nature of claim data, a combination of different definition elements is an approach that is commonly used to increase the reliability of proxy disease diagnoses.21 Our definition follows the methodology of validated administrative data algorithms that aim to balance specificity and sensitivity.21-23 This approach is also consistent with the previously developed definition of MS that was determined by a panel of NHF data experts and specialists in neurology.
RA cases were identified by at least 2 health care encounters with ICD‑10 codes M05 or M06, occurring at least 90 days apart, alongside at least 1 reimbursed prescription for a disease‑modifying antirheumatic drug (DMARD) based on Anatomical Therapeutic Chemical codes. Eligible DMARDs included methotrexate (L01BA01, L04AX03), sulfasalazine (A07EC01), leflunomide (L04AA13), or a biologic / targeted synthetic DMARD (as part of an NHF‑financed program). In the case of RA, the disease onset was defined at the second recorded health care encounter. The patients were further classified as seropositive RA (SPRA; ICD‑10 M05 claim) or seronegative RA (SNRA; ICD‑10 M06 claim) based on available diagnostic records. The patients recorded with both M05 and M06 codes during the observation period were excluded from all analyses; this approach was chosen to reduce double‑counting and incorrect classification, though it introduces an unknown degree of bias in terms of unspecified or transitional RA patterns. General characteristics of the patients with MS and RA are provided in Table 1.
Characteristic | Control | RA | ||
Continuous variables are presented as median (interquartile range), and categorical variables as percentage.
a Percentage of women was calculated among MS cases within each group.
Abbreviations: MS, multiple sclerosis; RA, rheumatoid arthritis | ||||
Status | Alive (n = 745) | Died (n = 68) | Alive (n = 430) | Died (n = 34) |
Age at MS diagnosis, y | 52 (46–58) | 57 (52–63) | 52 (41–57) | 58 (51–65) |
Womena | 87 | 85 | 89 | 74 |
Urban residence | 72 | 79 | 68 | 77 |
Control group
We used the Polish public payer database, covering over 38 million people with unique PESEL identifiers, as the recruitment pool. The controls were identified from the general population using random sampling (1:1) based on age, sex, and calendar year of the specific RA case index date (ie, the year when the RA patient to be matched fulfilled the case definition). No geographic strata were used. Each control was required to have at least 1 recorded health care encounter of any type (inpatient, outpatient, or rehabilitation service) within the same calendar year. This criterion was applied to ensure inclusion of individuals actively using the public health care system during the same period, which is particularly relevant for younger persons. Calendar‑year matching was performed to maintain a sufficient sampling pool (Figure 1).
![Trends in epidemiologic burden of multiple sclerosis (MS) in rheumatoid arthritis (RA) patients. Temporal patterns of incident (A) and prevalent (B) MS cases among patients with RA in the years 2011–2021, female proportion of newly diagnosed cases with MS (C), and median (interquartile range [IQR]) age at presumed diagnosis of MS among newly detected cases (D)](/paim/_next/image/?url=https%3A%2F%2Fpamw.pl%2Fsites%2Fdefault%2Ffiles%2Fjson_zip_files%2Funcompressed%2F17190%2FIMAGES%2FKP_WEB__FIG_01.png&w=3840&q=75)
Abbreviations: DMARD, disease‑modifying antirheumatic drug; ICD‑10, International Classification of Diseases, Tenth Revision; NHF, National Health Fund; PESEL, personal identification number; Rx, reimbursed prescription drug; others, see Table 1
Ethics approval and consent to participate
This analysis relied solely on data obtained from the NHF electronic databases. Obtaining institutional ethical approval was not required.
Availability of data and materials
The datasets used and analyzed in this study were derived from the administrative database of health care claims of the Polish NHF and the data regarding mortality under the Ministry of Digital Affairs. Due to data protection regulations and restrictions imposed by the NHF, the full dataset is not publicly available. However, aggregated data on MS prevalence and incidence in Poland can be accessed through the publicly available repository maintained by the Polish Ministry of Health at https://analizy.mz.gov.pl/html/zpa_sm/.
Access to the complete anonymized datasets analyzed in this study may be granted upon reasonable request and subject to approval by the relevant regulatory authorities.
Statistical analysis
All analyses were performed using R 4.4.1 package (R Core Team, 2024; R Foundation for Statistical Computing, Vienna, Austria). Annual MS incidence rates were calculated as the number of newly identified MS cases per calendar year divided by the mid‑year population at risk in each cohort, with 95% CIs estimated using the exact Poisson methods. Prevalence rates were calculated per 10 000 persons, with 95% CI estimated using the Wilson method. Differences in MS prevalence between RA patients and the comparator group were evaluated separately by sex and age strata using 2‑sample tests for proportions without continuity correction. The Fisher test was utilized if any observed or expected cell counts were below 5. The Spearman correlation was used to assess temporal incidence trends. Effect sizes were estimated using prevalence ratios (PRs) with 95% CIs calculated by the Katz log method for each strata. Pooled PRs for age and sex strata were calculated using the Mantel–Haenszel method. To account for multiple exploration comparisons, the Holm adjustment was applied and reported alongside raw P values. As a form of additional sensitivity analysis, the Poisson regression with robust SEs was used to compare RA serostatus subgroups (M05 and M06) with the control group, after adjusting for sex and age. All statistical tests were 2‑sided, and a P value below 0.05 was considered significant.
Results
Prevalence and incidence of multiple sclerosis in the Polish population
Using the adopted case definition, in 2021 there were 55 053 individuals in Poland living with MS, mostly women (70.9%), at a median age at diagnosis of 50 (32–52) years. In the same year, a total of 2588 new MS cases were identified, mostly in women (70.1%) at a median age of 37 (33–54) years. Overall, the prevalence of MS in Poland was estimated at 14.46 per 10 000 inhabitants, with higher rates in women (19.84) than in men (8.7). The incidence rate for MS in Poland in 2021 was 0.68 per 10 000 individuals, with a higher incidence in women (0.92 vs 0.42 in men).
Age‑dependent burden of multiple sclerosis in rheumatoid arthritis
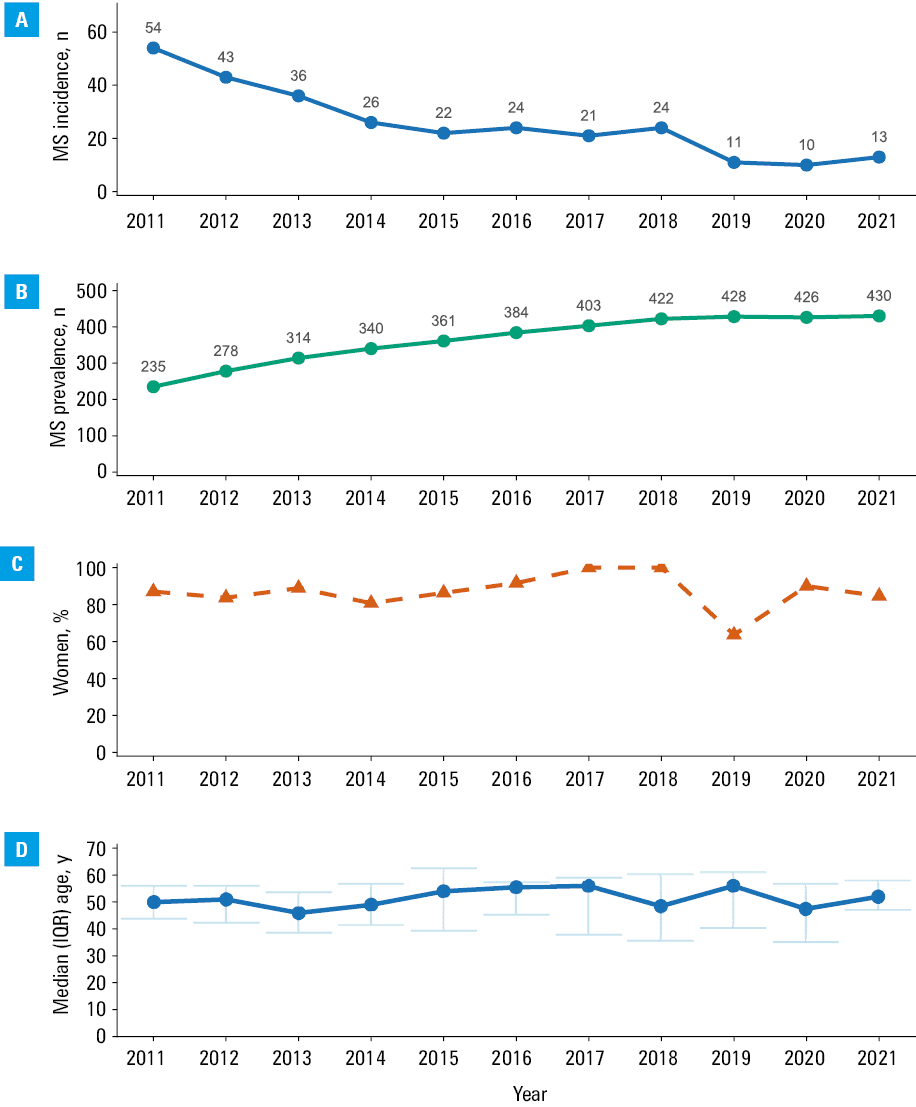
Among RA patients followed between 2009 and 2021, we identified 464 individuals (0.15%) with concurrent MS diagnosis, as compared with 813 MS cases (0.26%) among the matched controls. In general, RA patients had by 43% lower MS prevalence than the comparator group (Mantel–Haenszel PR, 0.57; 95% CI, 0.51–0.64; P <0.001). The majority of prevalent MS‑RA cases were women (87.7%), at a median (interquartile range [IQR]) age at diagnosis of 52 (41–58) years. Temporal trends in the burden and demographic structure of the MS‑RA population are shown in Figure 2. Over time, generally stable female predominance was observed, with median age at MS diagnosis increasing from the fifth to sixth decade of life (Table 2). In combination with declining incidence over time (z, –0.92; P <0.001; for incidence rates see Table 2), this suggests a relationship with changing demographic structure of the Polish population. Age and sex strata specific results are reported in Table 3 and Figure 3.
Year | Control (n = 307 519)a | RA (n = 307 519)a | ||||||
New MS cases, nb | Incidence (95% CI) per 100 000 personsc | Women, % | Age, median (IQR) | New MS cases, nb | Incidence (95% CI) per 100 000 personsc | Women, % | Age, median (IQR) | |
a Total RA and control group sizes (both n = 307 519) represent all persons identified using the case definition between 2009 and 2021. Each row shows new MS cases detected in a given year (not cumulative counts).
b New MS cases column refers to newly diagnosed (incident MS) patients within a given calendar year.
c 95% CI is conservatively calculated based on exact Poisson estimate using the total cohort size as a denominator.
Abbreviations: IQR, interquartile range; others, see Table 1 | ||||||||
2011 | 76 | 24.7 (19.5–30.9) | 92.1 | 54.5 (50–59) | 54 | 17.6 (13.2–22.9) | 87 | 50 (44–56) |
2012 | 75 | 24.4 (19.2–30.6) | 82.7 | 52 (43–58) | 43 | 14 (10.1–18.8) | 83.7 | 51 (42.5–56) |
2013 | 55 | 17.9 (13.5–23.3) | 87.3 | 54 (43.5–60) | 36 | 11.7 (8.2–16.2) | 88.9 | 46 (38.8–53.5) |
2014 | 38 | 12.4 (8.7–17) | 84.2 | 54 (47–60.8) | 26 | 8.5 (5.5–12.4) | 80.8 | 49 (41.5–56.8) |
2015 | 26 | 8.5 (5.5–12.4) | 88.5 | 52.5 (46.5–57) | 22 | 7.2 (4.5–10.8) | 86.4 | 54 (39.5–62.5) |
2016 | 36 | 11.7 (8.2–16.2) | 83.3 | 54 (47.8–60) | 24 | 7.8 (5–11.6) | 91.7 | 55.5 (45.5–57.2) |
2017 | 19 | 6.2 (3.7–9.6) | 89.5 | 53 (48–57.5) | 21 | 6.8 (4.2–10.4) | 100 | 56 (38–59) |
2018 | 15 | 4.9 (2.7–8) | 80 | 54 (52.5–57) | 24 | 7.8 (5–11.6) | 100 | 48.5 (35.8–60.2) |
2019 | 15 | 4.9 (2.7–8) | 86.7 | 55 (45.5–59.5) | 11 | 3.6 (1.8–6.4) | 63.6 | 56 (40.5–61) |
2020 | 17 | 5.5 (3.2–8.9) | 76.5 | 55 (47–60) | 10 | 3.3 (1.6–6) | 90 | 47.5 (35.2–56.8) |
2021 | 15 | 4.9 (2.7–8) | 93.3 | 49 (39.5–57.5) | 13 | 4.2 (2.3–7.2) | 84.6 | 52 (47–58) |
Sex | Age group, y | MS cases (control), na | MS cases (RA), na | Population per stratum (each group), nb | Prevalence in the controls (95% CI)c | Prevalence in all RA patients, (95% CI)c | PR (95% CI) | P value (raw) | P value (Holm adj.) |
a Number of individuals with MS in each group and stratum
b Total number of RA or control individuals within this specific category
c Prevalence is expressed per 10 000 persons (95% CI).
Abbreviations: adj., adjusted; PR, prevalence ratio; others, see Table 1 | |||||||||
Women | 16–39 | 62 | 86 | 23 091 | 26.9 (21–34.4) | 37.2 (30.2–46) | 1.39 (1–1.92) | 0.048 | 0.19 |
Women | 40–55 | 339 | 191 | 70 730 | 47.9 (43.1–53.3) | 27 (23.4–31.1) | 0.56 (0.47–0.67) | <0.001 | <0.001 |
Women | 56–65 | 235 | 101 | 74 067 | 31.7 (27.9–36) | 13.6 (11.2–16.6) | 0.43 (0.34–0.54) | <0.001 | <0.001 |
Women | ≥66 | 72 | 29 | 67 260 | 10.7 (8.5–13.5) | 4.3 (3–6.2) | 0.4 (0.26–0.62) | <0.001 | <0.001 |
Men | 16–39 | 12 | 9 | 7900 | 15.2 (8.7–26.5) | 11.4 (6–21.6) | 0.75 (0.32–1.78) | 0.51 | >0.99 |
Men | 40–55 | 39 | 25 | 20 847 | 18.7 (13.7–25.6) | 12 (8.1–17.7) | 0.64 (0.39–1.06) | 0.08 | 0.24 |
Men | 56–65 | 41 | 13 | 23 725 | 17.3 (12.7–23.4) | 5.5 (3.2–9.4) | 0.32 (0.17–0.59) | <0.001 | <0.001 |
Men | ≥66 | 13 | 10 | 19 899 | 6.5 (3.8–11.2) | 5 (2.7–9.2) | 0.77 (0.34–1.75) | 0.53 | >0.99 |
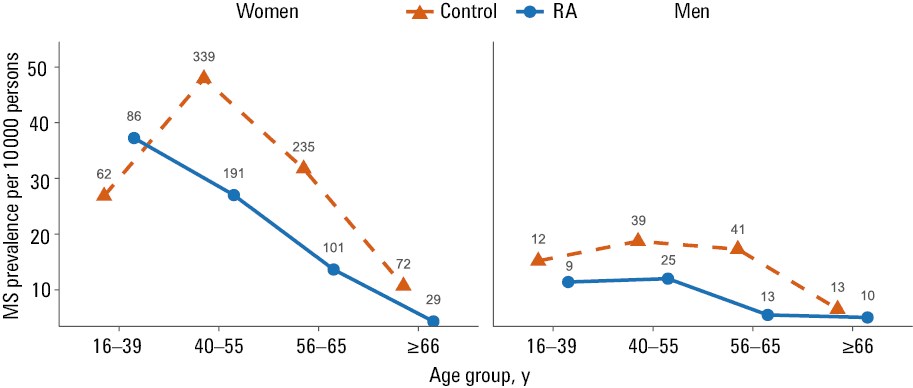
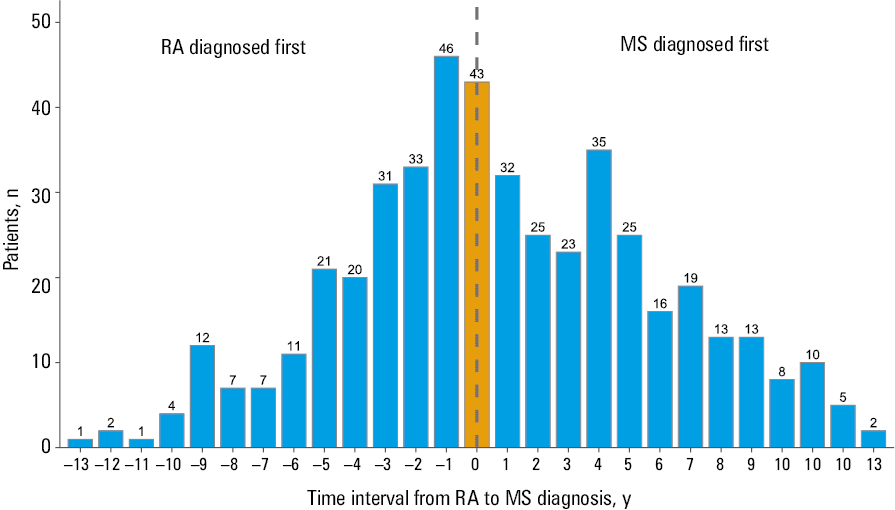
In women, the association between RA and MS prevalence differed across age groups. Young women (16–39 y) with RA showed higher MS prevalence (PR, 1.39; 95% CI, 1–1.92; P = 0.048; adjusted P = 0.19). Clear differences were observed among older women, in whom reduced MS prevalence was found (PR range, 0.56–0.4; all adjusted P <0.001). Overall mortality was similar in the RA patients (34/464; 7.3%) and the control group (68/813; 8.4%). The distribution of time intervals between RA and MS diagnoses is shown in Figure 4.
Effect of rheumatoid arthritis serostatus on multiple sclerosis prevalence
Within the RA group, the SPRA patients had lower MS prevalence than the SNRA ones (pooled PR, 0.68; 95% CI, 0.57–0.82; P <0.001; Table 4). In women, we observed significant differences in the older subgroup (40–55 y and ≥66 y; Table 4). In men, the small number of cases resulted in wide uncertainty. In the sensitivity analysis using the robust Poisson regression with shared controls, both subtypes had lower prevalence than the controls (PR for SNRA, 0.73; 95% CI, 0.58–0.92; PR for SPRA, 0.49; 95% CI, 0.39–0.61). Direct comparison between SPRA and SNRA suggests a reduced PR in seropositive disease (0.67; 95% CI, 0.5–0.9; P = 0.008).
Sex | Age group, y | MS cases (M05), n | MS cases (M06), n | Prevalence in M06 patients (95% CI)a | Prevalence in M05 patients (95% CI)a | PR (95% CI)b | P value (raw)c | P value (Holm adj.)d |
a Prevalence is shown per 10 000 persons based on Wilson 95% CIs.
b PRs were estimated using the Katz method.
c P values are based on the χ2 or Fisher test, as appropriate.
d Holm adjustment is reported to control type I error rate due to multiple exploratory comparisons.
| ||||||||
Women | 16–39 | 49 | 37 | 43.2 (31.3–59.5) | 33.7 (25.5–44.6) | 0.78 (0.51–1.2) | 0.26 | >0.99 |
Women | 40–55 | 98 | 93 | 38.2 (31.2–46.8) | 21.1 (17.3–25.7) | 0.55 (0.42–0.73) | <0.001 | <0.001 |
Women | 56–65 | 63 | 38 | 15.9 (11.6–21.9) | 12.5 (9.8–16) | 0.79 (0.53–1.18) | 0.24 | >0.99 |
Women | ≥66 | 10 | 19 | 8.2 (5.3–12.8) | 2.3 (1.2–4.2) | 0.28 (0.13–0.59) | <0.001 | 0.003 |
Men | 16–39 | 7 | 2 | 5.5 (1.5–20) | 16.4 (8–33.8) | 2.98 (0.62–14.36) | 0.19 | >0.99 |
Men | 40–55 | 20 | 5 | 7.5 (3.2–17.6) | 14.1 (9.1–21.7) | 1.87 (0.7–4.97) | 0.21 | >0.99 |
Men | 56–65 | 9 | 4 | 5.4 (2.1–13.9) | 5.5 (2.9–10.5) | 1.02 (0.32–3.32) | >0.99 | >0.99 |
Men | ≥66 | 6 | 4 | 5.9 (2.3–15.2) | 4.6 (2.1–10) | 0.77 (0.22–2.73) | 0.74 | >0.99 |
Discussion
This pilot study reports several novel findings that further characterize the risk of developing MS in patients with RA. Due to its nationwide scope, comprehensive analyses within age, sex, and serological status strata were performed. Our findings may help explain the variable risk association currently reported in literature. We identified young women with seronegative RA as a high‑risk group, in contrast with male patients in general. Our findings should be interpreted cautiously, keeping in mind the administrative nature of the claims data.
The positive relationship between RA and MS remains controversial, with substantial heterogeneity across populations. A large United Kingdom cohort study demonstrated modest positive, bidirectional associations between MS and RA, with a higher risk among RA patients.24 Similar results were published by Tseng et al,10 as well as other research groups.10,11,16,25 In contrast, Danish registry studies reported either inverse or null associations.26,27 Genetic analyses have revealed modest and limited overlap between MS and RA susceptibility loci.7 Moreover, data from case‑control studies imply a musculoskeletal prodrome preceding MS development that may complicate interpretation of this association.28,29
We observed that MS prevalence peaked among the patients diagnosed with RA at a younger age (16–39 y) and progressively declined with increasing age at RA diagnosis. Older patients with longstanding RA had a comparable risk of MS to the general population–based control group. Several mechanisms could account for these stratum‑specific patterns, including cumulative exposure to immunomodulating drugs over time, female hormones, and age‑related immunosenescence.13,30,31 Clinically, we would encourage increased vigilance for early MS symptoms in young women with seronegative RA.
Age and RA subtype appear tied to the strength of the MS‑RA association. From a mechanistic standpoint, both disorders are characterized with enhanced interleukine‑17 activity, which is tied to disease severity in both MS32,33 and RA.34 However, there are also important differences in cytokine and chemokine characteristics of these conditions, which can lead to harmful effects derived from common antirheumatic agents (eg, demyelinating episodes after antitumor necrosis factor α inhibitor use), but also immunomodulatory therapies (eg, RA onset after natalizumab treatment).5,25 The interaction between immune networks driving RA and MS is still largely unclear. Differences in immune crosstalk and mediators between RA subtypes could imply antibody‑mediated mechanisms as protective in seropositive RA.36 Notably, our results contrast with the findings of a nationwide study from South Korea, in which an enhanced risk of seropositive RA was recorded in MS patients.25 This could be derived from ethnic and demographic differences.
Population‑specific factors, such as demographics, genetic influence, and environmental exposure risks are likely to modify the observed association between RA and MS. Smoking is an overlapping risk factor, which remains a common habit, with estimates of about 12% of women and 17% of men recorded as active smokers.37 Vitamin D deficiency in Poland is also highly prevalent, with estimates around 90% of the population, including children and adults.38 Air pollution, which is common to urban areas and southern regions of Poland, is another factor that emerges in the context of immune dysregulation, including stimulation of inflammatory responses from Th1 and Th17 cells.39 We expect that in the future, in Poland, the shifting demographics and geographic exposures are likely to impact epidemiologic rates. Unfortunately, the NHF administrative database does not include individual‑level information on environmental exposures or lifestyle factors, such as smoking, vitamin D status, or pollution exposure. Although indirect approximations based on regional environmental statistics could be attempted, such analyses would provide limited, potentially biased insights due to the ecological nature of the data and the inability to ascertain individual‑level exposures within the NHF data structure. Future studies linking NHF data with environmental or biobank registries could help better elucidate these influences.
This study has several methodological limitations that should be emphasized. Despite regulatory audits, miscoding or misclassification in health care claims from the NHF is likely to occur. These types of errors are usually systematic, inherent to secondary sources, and are more likely to underestimate the risk association between RA and MS. Due to the inability to gather clinical data, we are unable to account for disease‑related covariates, such as disease duration, inflammatory activity, antibody profile (eg, anti‑CCP, rheumatoid factor), or type of biologic treatment. The absence of these variables remains a major limitation in terms of inference regarding the observed associations.
Patients with chronic health conditions are also more likely to have more frequent contacts with medical professionals, which could increase the diagnostic rates in this group, as compared with the general population comparator (otherwise referred to as surveillance bias). Although closer medical surveillance of the individuals with RA may theoretically lead to higher rates of MS diagnosis, such an effect would be expected uniformly across the demographic groups. Consequently, this mechanism may account for a modest overall increase in MS prevalence but is unlikely to explain the distinct pattern observed predominantly among younger women with seronegative disease. Lastly, the controls were required to have at least 1 health care contact in the index year, which may favor individuals with symptoms or high level of self‑awareness, and thus modestly elevate MS detection relative to the contemporary population.
The risk associations described in this report could be debatable, and require confirmation in other cohorts, as well as a mechanistic study. From an epidemiologic standpoint, important clinical (including laboratory data), environmental, and lifestyle factors (eg, smoking) could not be assessed due to the nature of the NHF database. The role of immunosuppressive therapy and active inflammation also remains an area of uncertainty when interpreting the association between different autoimmune diseases. Finally, as the records were only available from 2009 onward, we could not reliably capture disease duration prior to the first documented demyelinating event.
A major strength of this study is the use of a large, nationwide dataset, which allows for stratified analyses. By considering age, sex, and RA subtype, our findings allow for a detailed description of MS burden among RA patients. The near universal coverage of the public health care system via the NHF allows for a unique national case study,40 also reducing the impact of socioeconomic bias. Furthermore, the algorithms used to define RA and MS cases align with prior validated methodologies, which makes it easier to compare our findings with other population‑based studies.26 Future prospective cohort studies or robust registry‑linkage studies (eg, in combination with biobank data to account for genetic factors)41 are particularly warranted to confirm our findings of the variable risk differences attributable to age and sex. Efforts should also be made to study drug‑specific differences in risk moderation.42
Conclusions
This nationwide population‑based study describes the epidemiologic link between RA and MS. Rheumatologists and general practitioners caring for RA patients should remain alert to the possibility of MS, including atypical neurological symptoms. A high index of diagnostic suspicion should be retained in younger women aged from 16 to 40 years. While further prospective, observational studies on the age, sex, and serotype specific RA‑MS risk association need to be conducted, closer monitoring is warranted. The coexistence of autoimmune conditions may reflect an interface between shared and divergent mechanisms of immune dysregulation, which could explain the variable risk association across different age groups. Our findings point to the clinical need of tailored screening strategies among patients with autoimmune disorders, particularly those that may be present in clusters.
- Yang P, Qian F‑Y, Zhang M‑F, et al. Th17 cell pathogenicity and plasticity in rheumatoid arthritis. J Leukoc Biol. 2019; 106: 1233‑1240. | Crossref
- Alivernini S, Firestein GS, McInnes IB. The pathogenesis of rheumatoid arthritis. Immunity. 2022; 55: 2255‑2270. | Crossref
- Bar‑Or A, Li R. Cellular immunology of relapsing multiple sclerosis: interactions, checks, and balances. Lancet Neurol. 2021; 20: 470‑483. | Crossref
- Reich DS, Lucchinetti CF, Calabresi PA. Multiple sclerosis. N Engl J Med. 2018; 378: 169‑180. | Crossref
- Konen FF, Möhn N, Witte T, et al. Treatment of autoimmunity: the impact of disease‑modifying therapies in multiple sclerosis and comorbid autoimmune disorders. Autoimmun Rev. 2023; 22: 103312. | Crossref
ARTICLE INFORMATION