
Prevalence of sarcopenia, myopenia, and malnutrition in Polish patients with inflammatory bowel disease
Key words: inflammatory bowel disease, malnubesity, malnutrition, myopenia, sarcopenia

 CC BY 4.0
Prevalence of sarcopenia, myopenia, and malnutrition in Polish patients with inflammatory bowel disease
CC BY 4.0
Introduction: Inflammatory bowel disease (IBD), including Crohn disease (CD) and ulcerative colitis (UC), can lead to malnutrition and sarcopenia due to inflammation, reduced dietary intake, and side effects of treatment.
Objectives: This study aimed to assess the prevalence of sarcopenia, myopenia, and malnutrition in Polish IBD patients using practical clinical tools, and to examine the relationship between patient nutritional knowledge and their nutritional status.
Patients and methods: The study included 91 IBD patients (48 with CD, 43 with UC), aged 18–65 years. Sarcopenia was assessed using the SARC‑F questionnaire and 5‑times sit‑to‑stand test, while myopenia was evaluated using the fat‑free mass index. Nutritional status was determined based on body mass index (BMI), Nutritional Risk Screening (NRS‑2002) scale, biochemical parameters, and body composition analysis. A custom‑designed questionnaire was used to assess patient nutritional knowledge.
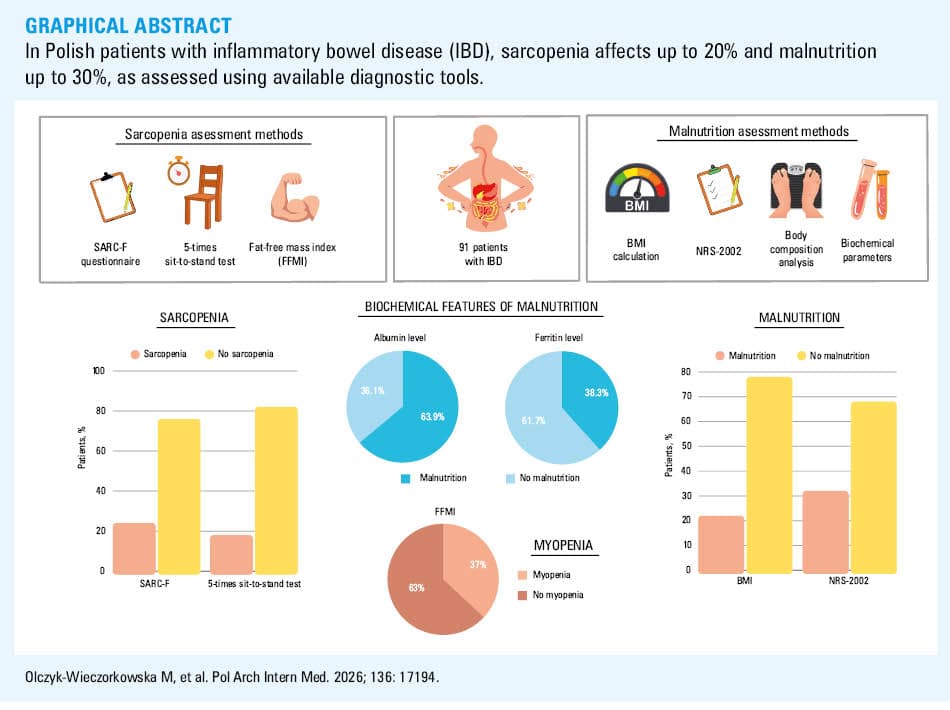
Results: Malnutrition was identified in 22% (BMI) and 31.9% (NRS‑2002) of the patients. Hypoalbuminemia and low ferritin levels were observed in 64% and 38.3% of the participants, respectively. Sarcopenia was present in 24.3% (SARC‑F) and 17.6% (sit‑to‑stand test) of the patients, while myopenia was detected in 36.7%. Both were more frequent during active disease. Nutritional knowledge was adequate in 23% of the patients but showed no association with nutritional status or muscle mass. Biologic therapy was associated with better nutritional status.
Conclusions: Malnutrition and sarcopenia are common in IBD, particularly during active disease. While biologic therapy may improve nutritional status, its effect on muscle mass is unclear. The lack of association between nutritional knowledge and clinical outcomes highlights the importance of continuous dietary support.
What's new?
This study addresses a significant gap in the existing literature by examining the prevalence of myopenia and sarcopenia in Polish patients with inflammatory bowel disease (IBD). Our findings demonstrate that these conditions, traditionally associated with aging, are also common among patients with IBD, particularly during the active phase of the disease. This underscores the critical role of inflammation in their pathogenesis. Our results also indicate that relying solely on body mass index may underestimate the presence of malnutrition, emphasizing the need for a comprehensive nutritional assessment. Furthermore, by assessing patient nutritional knowledge, we underscore the essential role of dietitians in the multidisciplinary management of IBD.
Introduction
Improper nutritional status is a significant complication of chronic gastrointestinal disorders, such as inflammatory bowel disease (IBD), which has 2 primary forms: Crohn disease (CD) and ulcerative colitis (UC). IBD is characterized by a complex etiology involving genetic predisposition, immune system dysfunction, and environmental factors. The causes of malnutrition in IBD are multifactorial and include increased protein and energy requirements due to chronic inflammation, reduced oral intake, malabsorption, nutrient loss through the gastrointestinal tract, gut microbiota dysbiosis, and side effects of pharmacological therapies.1 Traditionally, malnutrition in IBD patients has been associated with underweight status; however, it is now recognized that malnutrition can also occur in individuals with excess body weight, including those with sarcopenic obesity—a condition marked by the coexistence of obesity and sarcopenia.2
The global epidemic of overweight and obesity is increasingly evident, and recently, this trend has also been observed among patients with IBD.3 Therefore, one of the key challenges in evaluating nutritional status and the prevalence of sarcopenia is the phenomenon of “malnubesity,” that is, malnutrition masked by obesity. Obesity has been identified as a potential risk factor for the development of IBD, particularly CD.3 Conversely, patients with IBD are also at a risk for increased body fat accumulation due gut microbiota imbalance, glucocorticoid or biologic therapy, and suboptimal dietary and lifestyle habits.4 Moreover, excess body weight is associated with a higher risk of several comorbidities, such as cancer, diabetes, and other autoimmune diseases, which may further aggravate malnutrition.2
Sarcopenia, closely linked to malnutrition, is a syndrome characterized by the loss of muscle mass, strength, and physical performance.5 While traditionally associated with aging, sarcopenia also affects individuals with chronic diseases, including IBD, irrespective of age. Both malnutrition and sarcopenia are associated with poorer clinical outcomes in IBD, including an increased risk of hospitalization, disease exacerbation, surgical intervention, and postoperative complications.6 Current guidelines recommend regular assessment of nutritional status in all IBD patients.7 However, effective tools for evaluating nutritional status in this population are lacking. Most available methods rely on body mass index (BMI), which inadequately reflects nutritional health in many cases. Tools used to diagnose sarcopenia are primarily designed for geriatric populations and do not account for specific characteristics of IBD patients. Conversely, gold‑standard methods, such as imaging techniques for assessing muscle mass, are impractical for routine clinical use.
This study aimed to assess the prevalence of malnutrition, sarcopenia, and myopenia among IBD patients in Poland using methods available in routine clinical practice. It also sought to compare the usefulness of commonly available tools for evaluating malnutrition and sarcopenia in this population. Furthermore, the study assessed patient knowledge of nutritional principles and dietary behaviors, and explored the relationship between nutritional knowledge and nutritional status, including the presence of sarcopenia.
Patients and methods
Study population
A total of 91 patients with IBD were included in the study conducted between March and July 2024. Among them, 22 individuals (24.2%) had been diagnosed within the past year, and 29 (31.9%) were receiving biologic therapy. IBD diagnosis was established by a gastroenterologist in accordance with the European Crohn’s and Colitis Organization guidelines.8 Disease activity was assessed using the Crohn’s Disease Activity Index (CDAI) for patients with CD and the partial Mayo score for patients with UC.9,10 The patients were classified into 2 groups based on disease activity: active (CDAI ≥150 or partial Mayo score ≥2) and inactive (CDAI <150 or partial Mayo score <2). Patient characteristics are presented in Table 1. Inclusion criteria were as follows: written informed consent to participate, age between 18 and 65 years, and a confirmed diagnosis of IBD, with at least left‑sided colitis in patients with UC. Exclusion criteria encompassed active malignancy, acute viral or bacterial gastrointestinal infections, other chronic gastrointestinal diseases (eg, celiac disease, microscopic colitis), pregnancy or breastfeeding, presence of a stoma, eating disorders, heart failure, renal failure, nephrotic syndrome, neurological diseases (eg, multiple sclerosis, Parkinson disease, neuropathy), movement disorders, liver cirrhosis, chronic obstructive pulmonary disease, and use of total parenteral nutrition.
Parameter | IBD patients (n = 91) | |
Data are presented as number (percentage) or median (interquartile range).
Abbreviations: BMI, body mass index; CD, Crohn disease; IBD, inflammatory bowel disease; UC, ulcerative colitis | ||
Sex | Men | 55 (60.4) |
Women | 36 (39.6) | |
Age, y | 33 (26–42) | |
Disease type | CD | 48 (52.7) |
UC | 43 (47.3) | |
Disease phase | Remission | 30 (33) |
Active | 61 (67) | |
Disease duration, y | 6 (2–12) | |
BMI, kg/m2 | 22.3 (19.4–25.2) | |
The study was conducted in accordance with the Declaration of Helsinki. Its protocol was approved by the Bioethics Committee of the Jagiellonian University (1072.6120.8.2024). Written informed consent was obtained from all participants prior to enrollment.
Biochemical analysis
Blood samples were collected from all participants to assess complete blood count and serum concentrations of sodium, potassium, C‑reactive protein (CRP), ferritin, and albumin. Stool samples were also obtained to measure fecal calprotectin levels. All laboratory tests were performed at the Diagnostics Department of the University Hospital in Kraków, Poland, following standard procedures.
Assessment of sarcopenia and myopenia
An extended evaluation of sarcopenia was performed using the SARC‑F questionnaire (Strength, Assistance in walking, Rise from a chair, Climb stairs, and Falls)11 and the 5‑times sit‑to‑stand test. Myopenia was assessed using the fat‑free mass index (FFMI).
All participants completed the 5‑item SARC‑F questionnaire,11 which has a maximum score of 10 points. A score of 4 points or higher was considered indicative of a risk for sarcopenia.12 The 5‑times sit‑to‑stand test assessed lower limb strength by measuring the time required to rise from a chair 5 times with arms crossed over the chest. A time longer than 15 seconds indicated reduced muscle strength.13 The FFMI was calculated using the following formula: FFMI = fat‑free mass (FFM)/height2 (kg/m2), where fat‑free mass was obtained from the body composition analysis performed using bioelectrical impedance analysis (BIA). Cutoff values indicating reduced muscle mass (myopenia) were below 18 kg/m2 for men and below 15 kg/m2 for women.14
Nutritional status assessment
Nutritional status was evaluated using the following methods: 1) Nutritional Risk Screening 2002 (NRS‑2002) scale, 2) BMI, and 3) BIA to assess body composition.
The NRS‑2002 scale is a validated tool for assessing nutritional risk, incorporating 2 main components: 1) deterioration in nutritional status, measured by weight loss, BMI, and reduced food intake, and 2) disease severity, which reflects increased energy requirements.15
The scale yields a total score ranging from 0 to 7 points. The score of 3 points or higher indicates a high risk of malnutrition and the need for nutritional intervention.
BMI was calculated using patient height and weight and categorized as follows: underweight (<18.5 kg/m2), normal weight (18.5–24.99 kg/m2), overweight (≥25–29.99 kg/m2), and obesity (≥30 kg/m2). While BMI is a widely used screening tool, it does not consider body composition or directly reflect nutritional health.
BIA was performed using the TANITA DC‑430 S MA analyzer (Tanita, Tokyo, Japan). The assessment included measurement of fat mass, muscle mass, FFM, total body water, bone mass, and visceral fat. BMI was also calculated based on BIA‑derived weight.
Qualitative malnutrition was evaluated using serum albumin and ferritin levels. Hypoalbuminemia was defined as an albumin level below 39.7 g/l, and low ferritin as below 30 μg/l, in accordance with the reference ranges of the diagnostic laboratory.
Assessment of participant knowledge of nutritional principles and dietary behaviors
All participants completed a custom‑designed questionnaire assessing their knowledge of recommended nutritional principles and dietary behaviors in IBD, and their current dietary habits and lifestyle. The clinical nutrition questions were based on the 2023 guidelines of the European Society for Clinical Nutrition and Metabolism7 and the 2024 guidelines of the American Gastroenterology Association.16
The questionnaire addressed topics such as dietary recommendations during remission and exacerbation phases, prior dietary consultations, self‑assessed nutritional knowledge, sources of dietary information (multiple‑choice format), the perceived importance of diet in IBD management, and the impact of diet on disease symptoms.
To evaluate patient nutritional knowledge, responses to 15 questions from the questionnaire were analyzed (Table 2). Each correct response was awarded 1 point, yielding a total score ranging from 0 to 15. Based on the number of correct answers, the patients were categorized into 2 groups, with the scores below 9 indicating a low level of knowledge, and those of 9 or higher reflecting a good level of knowledge regarding proper nutritional principles.
Question | Scored response |
Abbreviations: see Table 1 | |
Do you think daily diet has an impact on the occurrence of your symptoms? | YES |
Should the diet in remission be based on the same principles as in exacerbation? | NO |
Do you think that a dietitian consultation is necessary in IBD? | YES |
Do you think the help of a dietitian may be necessary to personalize your nutrition? | YES |
Where do you get your information about nutrition in IBD? (multiple‑choice) | At least 2 of: nutritionist, doctor, professional literature |
Do you think the daily diet should be changed during the exacerbation period? | YES |
Do you think that during remission of the disease, nutrition should be based on standards for the healthy population? | YES |
Do you think dietary fiber should be restricted during remission of the disease? | NO |
Do you think that during the remission of the disease all patients should limit dairy products regardless of the complaints? | NO |
Do you restrict food products during the exacerbation period for fear of ailments? | NO |
Do you eliminate food products because that is what you heard from someone, regardless of whether there are ailments after consuming these products? | NO |
Do you restrict food products that you directly associate with the ailment during the exacerbation period? | YES |
During the exacerbation period, is it always necessary to eliminate selected food products, even from a diet based on healthy eating principles? | NO |
During the exacerbation period, should dairy products be strictly limited? | NO |
During the exacerbation period, should fiber‑rich foods be completely eliminated? | NO |
Statistical analysis
Associations between dichotomous variables were tested using the Yates‑corrected Pearson χ2 test. The strength of these associations was assessed using odds ratio (OR) with 95% CI and the Yule Φ coefficient. For parameters measured on an interval scale, differences between the groups were assessed using the Mann–Whitney test. A P value below 0.05 was considered significant. The results obtained on such a scale are presented as mean (SD) or median (interquartile range [IQR]), depending on the type of variable. Both the number of observations and percentages were used to present quantitative variables. The statistical analyses were performed using STATISTICA package v.14.1.0.4. (TIBCO Software Inc., Palo Alto, California, United States) and an online tool available at https://statpages.info/ctab2 × 2.html for calculating ORs and other contingency Table–related parameters.
Results
Occurrence of sarcopenia and myopenia
In the total study population, sarcopenia was identified in 18 patients (24.3%) based on the SARC‑F questionnaire, with 17 cases assessed during the active phase and 1 during remission. Using the 5‑times sit‑to‑stand test, sarcopenia was confirmed in 13 patients (17.6%), including 12 in the active phase and 1 in remission. Myopenia was diagnosed in 33 patients (36.7%), with 30 cases in the active phase and 3 in remission.
The distribution of sarcopenia and myopenia by disease type is presented in Table 3.
Clinical feature | Assessment method | CD | UC | OR (95% CI) or P valuea |
a Mann–Whitney test; b CD (n = 37), UC (n = 37); c CD (n = 47), UC (n = 43)
Abbreviations: FFMI, fat‑free mass index; IQR, interquartile range; OR, odds ratio; SARC‑F, Strength, Assistance in walking, Rise from a chair, Climb stairs, and Falls; others, see Table 1 | ||||
Sarcopenia | SARC‑F questionnaire (yes / no), n (%)b | 6/31 (16.2/83.8) | 12/25 (32.4/67.6) | 0.4 (0.13–1.23) |
5‑times sit‑to‑stand test (yes / no), n (%)b | 5/32 (13.5/86.5) | 8/29 (21.6/78.4) | 0.57 (0.17–1.23) | |
Myopenia | FFMI, median (IQR)c | 17.4 (14.8–20.3) | 17.7 (16.2–19.1) | P = 0.67 |
Nutritional status assessment
Malnutrition was identified in 20 patients (22%) based on BMI, including 3 in the remission phase and 17 in the active phase, and in 29 patients (31.9%) based on the NRS‑2002 tool, with 1 in remission and 28 in the active phase. Additionally, based on BMI, 17 patients (18.7%) were classified as overweight and 8 (8.8%) as obese.
Biochemical markers indicated malnutrition in a substantial proportion of the patients. Hypoalbuminemia was observed in 39 individuals (64%), including 4 in the remission phase and 35 in the active phase. Low ferritin levels were identified in 23 patients (38.3%), with 8 in remission and 15 in the active phase.
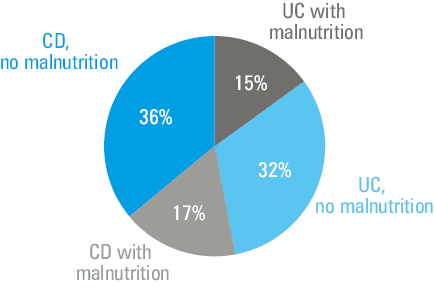
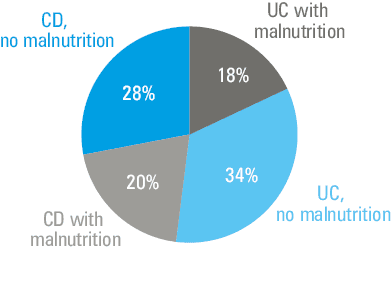
The occurrence of malnutrition and biochemical markers of qualitative malnutrition by disease type are presented in Table 4. The distribution of patients in the entire group with or without malnutrition by types of IBD is presented in Figures 1 and 2.
Parameter | Assessment method | CD | UC | OR (95% CI) |
a CD (n = 48), UC (n = 43); b CD (n = 32), UC (n = 29); c CD (n = 29), UC (n = 31)
| ||||
Malnutrition | BMI <18.5 kg/m2 (yes / no), n (%)a | 14/34 (29.2/70.8) | 6/37 (14/86) | 2.54 (0.88–7.36) |
NRS‑2002 ≥3 (yes / no), n (%)a | 15/33 (31.3/68.8) | 14/29 (32.6/67.4) | 0.94 (0.39–2.78) | |
Biochemical marker | Albumin level <39.7 g/l (yes / no), n (%)b | 18/14 (56.3/43.7) | 21/8 (72.4/27.6) | 0.81 (0.26–2.53) |
Ferritin level <30 μg/l (yes / no), n (%)c | 12/17 (41.4/58.6) | 11/20 (35.5/64.5) | 1.17 (0.45–3.05) | |
Abbreviations: see Table 1
Occurrence of sarcopenia and myopenia in relation to disease activity, nutritional status, and physical activity level
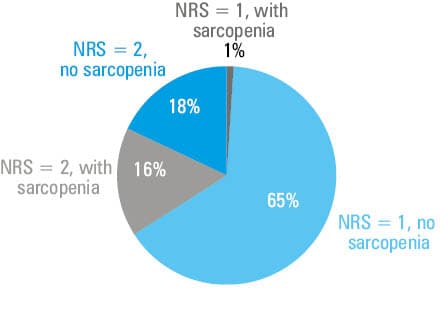
The presence of sarcopenia, as assessed by the SARC‑F questionnaire, was significantly less common in the patients with inactive disease (OR, 0.08; 95% CI, 0.01–0.63) and in those classified as well‑nourished based on the NRS‑2002 scale (OR, 0.07; 95% CI, 0.02–0.25). Moreover, in the patients with adequate nutritional status according to the NRS‑2002 scale, better results of the 5‑times sit‑to‑stand test were much more frequent (OR, 44.31; 95% CI, 5.27–372.86). The distribution of patients with or without sarcopenia and concomitant malnutrition is presented in Figure 3.
Abbreviations: see Table 4
A similar trend was observed for myopenia. A considerable difference in FFMI values was found between the patients in the inactive phase (mean, 19.8 [3.2] kg/m2) and those in the active phase of the disease (mean, 16.8 [2.2] kg/m2; P <0.001 for both). The absence of myopenia was significantly more common in the patients with adequate nutritional status, as assessed by the NRS‑2002 scale, as compared with those with malnutrition (OR, 27.73; 95% CI, 8.39–91.66). The distribution of patients with or without myopenia and concomitant malnutrition is presented in Figure 4. BMI was positively associated with both muscle mass and fat mass (P <0.05).
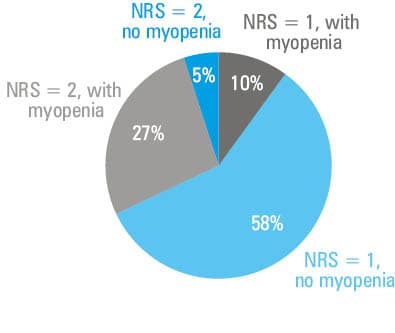
Abbreviations: see Table 4
A significant negative association was observed between regular physical activity and occurrence of myopenia (OR, 0.24; 95% CI, 0.09–0.64), as compared with the patients who did not report engaging in such activity. Although no similar association was found for sarcopenia, the patients who regularly participated in physical activity were more likely to have an adequate nutritional status based on the NRS‑2002 scale (OR, 3.75; 95% CI, 1.36–10.32). Additionally, over 54% of the patients reported a reduction in physical activity following their IBD diagnosis.
No significant association was found between the occurrence of sarcopenia or myopenia and disease type, patient sex, or disease duration. However, in the patients younger than 32 years, the presence of sarcopenia (assessed by the SARC‑F questionnaire) was nearly 4‑fold less likely than in older individuals (OR, 0.27; 95% CI, 0.08–0.86).
Laboratory findings in the patients with myopenia
The patients with myopenia had lower levels of hemoglobin (P = 0.008) and albumin (P = 0.002) than those without myopenia. Median (IQR) hemoglobin levels in the myopenia and nonmyopenia group were 6.7 (5.9–7.7) mmol/l and 7.9 (6.4–9.2) mmol/l, respectively. Median albumin levels were 35 (30.4–38) g/l in the patients with myopenia, and 39 (34.4–43.5) g/l in those without. No significant differences were detected in ferritin or calprotectin levels between these patient groups.
Laboratory findings according to disease activity
Considerable differences were noted between disease phase and both CRP levels (P <0.001) and BMI values (P = 0.001). No significant differences were found in calprotectin levels. Median CRP levels in active disease and remission were 19 (4.1–46.6) mg/l and 1.9 (1–8.7) mg/l, respectively. Median BMI in the patients with active disease and remission was 21.6 (19–25) kg/m2 and 22.7 (19.7–27.7) kg/m2, respectively.
Nutritional status and sarcopenia in relation to biologic therapy
The patients receiving biologic therapy significantly less often suffered from malnutrition, as assessed by the NRS‑2002 scale (OR, 0.33; 95% CI, 0.11–0.98). A trend toward reduced occurrence of sarcopenia was also noted in this group, based on the SARC‑F questionnaire. However, no significant differences in muscle mass percentage were observed between the patients receiving and not receiving biologic therapy.
Level of nutritional knowledge
Approximately 23% of the patients scored 9 points or more in the nutritional knowledge questionnaire, indicating a good level of understanding of proper dietary principles. However, a higher level of nutritional knowledge was not associated with improved nutritional status or a reduced prevalence of sarcopenia and myopenia.
Additional findings
No significant association was found between a reduction in meal frequency during the active phase of the disease and the prevalence of sarcopenia, myopenia, or malnutrition as assessed by the NRS‑2002 scale. No significant association was found between malnutrition assessed by NRS‑2002 scale and the occurrence of CD or UC.
Discussion
In this study, we comprehensively evaluated the prevalence of malnutrition, sarcopenia, and myopenia among Polish patients with IBD. Malnutrition assessed by BMI was less common than that assessed by the NRS‑2002 scale. The higher prevalence determined with the NRS‑2002 scale may reflect its broader assessment criteria, which include not only nutritional status deterioration (eg, low BMI) but also disease severity, which increases nutritional demands. In clinical practice, the NRS‑2002 scale is widely used as a screening tool due to its simplicity and ease of administration. However, its effective application depends on patient cooperation and accurate reporting of changes in dietary intake and body weight. This tool appears particularly suitable for the IBD population, who are typically young adults.17
Alternative methods used to assess nutritional status in this study included serum albumin and ferritin measurements. Hypoalbuminemia was identified in 64% of the patients, and low ferritin levels in 38.3%, with both conditions more frequently observed during the active phase of the disease than in remission. Albumin is a negative acute‑phase protein, and its levels decrease during inflammation, potentially limiting its utility as a standalone marker of nutritional status.18 Although some studies suggested that albumin should not be used to assess malnutrition due to its sensitivity to inflammatory changes,19 our findings suggest that it may still be a valuable indicator of malnutrition in IBD patients when interpreted alongside other clinical parameters.
In contrast, ferritin is an acute‑phase reactant and may be elevated during inflammatory states, such as IBD, complicating its use in evaluating nutritional status, particularly in the cases of qualitative malnutrition.20 This was reflected in our study, as ferritin levels did not differ significantly in the patients with and without myopenia. However, the patients with myopenia had greater prevalence of anemia, as indicated by lower hemoglobin levels.
Accurate assessment of nutritional status is crucial for identifying malnutrition in patients with IBD.21 Our findings show that reliance on BMI alone may underestimate malnutrition. While BMI identified a smaller proportion of patients as malnourished, the use of additional tools, such as the NRS‑2002 scale and biochemical markers, provided a more comprehensive evaluation. Notably, over 27% of the patients in our cohort had elevated BMI values, and 44% of these were in the active phase of the disease, despite the traditional association between disease exacerbation and malnutrition. Although higher BMI values were linked to greater muscle and fat mass, this did not necessarily reflect adequate nutritional status, highlighting the phenomenon of “malnubesity”. Increased BMI may obscure muscle wasting and micronutrient deficiencies, rendering BMI alone an insufficient indicator of nutritional health. Moreover, excess body weight is associated with a chronic low‑grade inflammatory state, driven by the secretion of proinflammatory mediators from hypertrophic adipocytes in mesenteric visceral fat.22 Additionally, obesity‑related alterations in immune function and gut microbiota composition may further disrupt intestinal homeostasis, perpetuating inflammation and exacerbating IBD.23 These findings emphasize the importance of using a multiparameter approach to ensure a more accurate and thorough evaluation of nutritional status in IBD patients.
To our knowledge, comprehensive data on the prevalence of sarcopenia among Polish IBD patients are currently lacking. In this study, sarcopenia was identified in approximately 20% of the patients, with prevalence varying by assessment method (24% based on the SARC‑F questionnaire and 17% using the 5‑times sit‑to‑stand test). Additionally, myopenia was present in over 36% of the patients. Our analysis revealed a higher prevalence of sarcopenia among the individuals diagnosed with malnutrition, highlighting the close relationship between nutritional status and muscle mass loss. These findings suggest that sarcopenia is a clinically significant concern in this patient population, which is in line with previously published European data. For example, a 2024 study from Turkey reported a sarcopenia prevalence of approximately 18% among IBD patients.24
We observed that the patients in the active phase of the disease were significantly more likely to exhibit features of both sarcopenia and myopenia, as compared with those in remission. This difference can be attributed to heightened inflammatory response, increased muscle catabolism, and impaired muscle function during disease exacerbation.25 Active disease is also frequently associated with malnutrition, reduced appetite, and malabsorption, that is, factors that further contribute to muscle mass loss and the development of sarcopenia and / or myopenia. Conversely, while clinical remission is typically associated with reduced inflammation and improved nutritional status, many patients continue to exhibit persistent deficits in FFM. This may be explained by subclinical inflammation, which can persist despite the absence of overt symptoms, and by the cumulative impact of previous disease activity and flare‑ups. Our findings support this hypothesis, as we observed no significant differences in ferritin or calprotectin levels (both markers of inflammation) in the patients with and without myopenia.
Notably, prior hospitalizations and the severity of previous disease activity have been identified as predictors of sarcopenia, highlighting the long‑term impact of active disease phases on body composition.26 Although our study did not specifically assess these factors during remission, the potential for lasting complications, such as sarcopenia, underscores the importance of evaluating muscle health regardless of the current disease activity. Interestingly, in our cohort, myopenia was associated with the lack of regular physical activity, whereas no such relationship was observed for sarcopenia. Additionally, we found no significant difference in the prevalence of sarcopenia or myopenia based on the type of IBD. This contrasted with findings from a 2019 meta‑analysis, which reported a higher prevalence of sarcopenia in patients with CD (52%) than UC (37%).27 These discrepancies emphasize the need for further research in larger patient populations to elucidate the relationship between IBD subtype and the prevalence of sarcopenia.
Such an approach, based on readily available sarcopenia screening tools, ensures that the methods employed are accessible to health care providers across various clinical settings, enhancing their practicality and feasibility for widespread implementation. In our study, we demonstrated that all the screening tools used to detect sarcopenia can be effectively applied in patients with IBD. However, further research is needed to determine which method is most reliable and clinically useful in this population. Diagnosing sarcopenia is crucial, as it is associated with adverse outcomes, including reduced quality of life, prolonged hospitalization, and an increased risk of postoperative complications.28 Early identification of sarcopenia may support the optimization of therapeutic strategies and facilitate more rapid achievement of disease remission.29
Our findings also suggest that biologic therapy may have a beneficial impact on the nutritional status of patients with IBD. This aligns with previous studies reporting improvements in body weight, BMI, and FFM among patients receiving biologic therapy for other chronic inflammatory conditions, such as ankylosing spondylitis and rheumatoid arthritis, that is, conditions in which biologics have been shown to positively influence body composition.30,31 In our study, the 3‑fold lower prevalence of malnutrition (as assessed by the NRS‑2002 scale) among the patients receiving biologic therapy may reflect its role in reducing inflammation and improving nutritional status. Notably, none of the patients undergoing biologic treatment were classified as sarcopenic based on the SARC‑F questionnaire. However, no significant differences in muscle mass were observed between the patients receiving and not receiving biologic therapy. This may suggest that biologic therapy helps prevent functional sarcopenia, defined as impaired muscle strength and physical performance even in the absence of significant muscle mass loss, while its effect on actual muscle mass may require longer treatment duration to become evident, as reported in prior studies.32 It is also important to consider that tumor necrosis factor α inhibitors have been associated with increases in fat mass,33 which may partially explain the lack of observed differences in muscle mass between the 2 groups.
Our study did not identify a significant association between the level of nutritional knowledge and improvements in nutritional status or a reduced risk of sarcopenia and myopenia. Similarly, no meaningful relationship was observed between nutritional outcomes and a reduction in meal frequency. These findings suggest that knowledge and dietary awareness alone may be insufficient to produce measurable clinical improvements. Instead, they underscore the influence of other critical factors, including disease activity, the patient ability to implement dietary recommendations, access to professional nutritional guidance, and individual motivation. As such, effective nutritional interventions in IBD may require a personalized, multidisciplinary approach that integrates continuous education with practical support to help patients translate knowledge into sustained behavioral change while managing disease‑specific challenges.
It is important to emphasize that we intentionally selected assessment tools that do not require specialized equipment. All methods used in this study are accessible to health care professionals across various clinical settings, enhancing their practicality and feasibility for routine application. We demonstrated that the tools employed for detecting malnutrition and sarcopenia can be effectively implemented in patients with IBD. However, further research is warranted to determine the most reliable and clinically appropriate method.
This study has several limitations. The relatively small sample size may limit generalizability of the findings. Additionally, the study population was heterogeneous, with a predominance of men and an overrepresentation of patients in the active phase of the disease. Variability in the conditions under which BIA was performed, such as variations in fasting status, may also have influenced the results. The questionnaire assessing the level of nutritional knowledge was prepared by the authors of the study and has not been validated.
Conclusions
In conclusion, this study highlights the significant prevalence of malnutrition, sarcopenia, and myopenia in IBD patients, underscoring the need for comprehensive assessment tools that can accurately evaluate nutritional and muscle health in both active and inactive disease. Our findings demonstrate that the NRS‑2002 scale, when used alongside biochemical markers and physical assessment tools, provides a more reliable and multidimensional evaluation than BMI alone. Importantly, malnutrition was observed across both active and remission phases, and may obscure the presence of sarcopenia and myopenia. Both conditions were particularly associated with active disease, reinforcing the negative impact of inflammation on muscle mass and strength.
Although biologic therapies demonstrated beneficial effects on nutritional status, their influence on muscle mass remains unclear and warrants further investigation. Additionally, the absence of a significant association between nutritional knowledge and clinical outcomes suggests that knowledge alone is insufficient to result in measurable improvements. These findings highlight the need for ongoing, individualized nutritional support, particularly through regular consultation with a dietitian, as an integral component of comprehensive IBD management.
- Balestrieri P, Ribolsi M, Guarino MPL, et al. Nutritional aspects in inflammatory bowel diseases. Nutrients. 2020; 12: 372. | Crossref
- Massironi S, Viganò C, Palermo A, et al. Inflammation and malnutrition in inflammatory bowel disease. Lancet Gastroenterol Hepatol. 2023; 8: 579‑590. | Crossref
- Khalili H, Ananthakrishnan AN, Konijeti GG, et al. Measures of obesity and risk of Crohn’s disease and ulcerative colitis. Inflamm Bowel Dis. 2015; 21: 361‑368. | Crossref
- Kaazan P, Tan Z, Maiyani P. Weight and BMI patterns in a biologicals‑treated IBD cohort. Dig Dis Sci. 2022; 67: 5628‑5636. | Crossref
- Krzymińska‑Siemaszko R. Sarcopenia 2018 ‑ updated diagnostic criteria to diagnosis muscle failure. Geriatria. 2018; 12: 227‑234. | Crossref
ARTICLE INFORMATION