
SCORE2 and a derived model based on traditional risk factors in predicting cardiovascular disease mortality: 18-year follow-up of the Polish cohort participating in the HAPIEE study
Key words: calibration, cardiovascular risk, discrimination, prediction models, SCORE2

 CC BY 4.0
SCORE2 and a derived model based on traditional risk factors in predicting cardiovascular disease mortality: 18-year follow-up of the Polish cohort participating in the HAPIEE study
CC BY 4.0
Introduction: Accurate risk prediction in cardiovascular disease (CVD) is crucial for personalized preventive medicine.
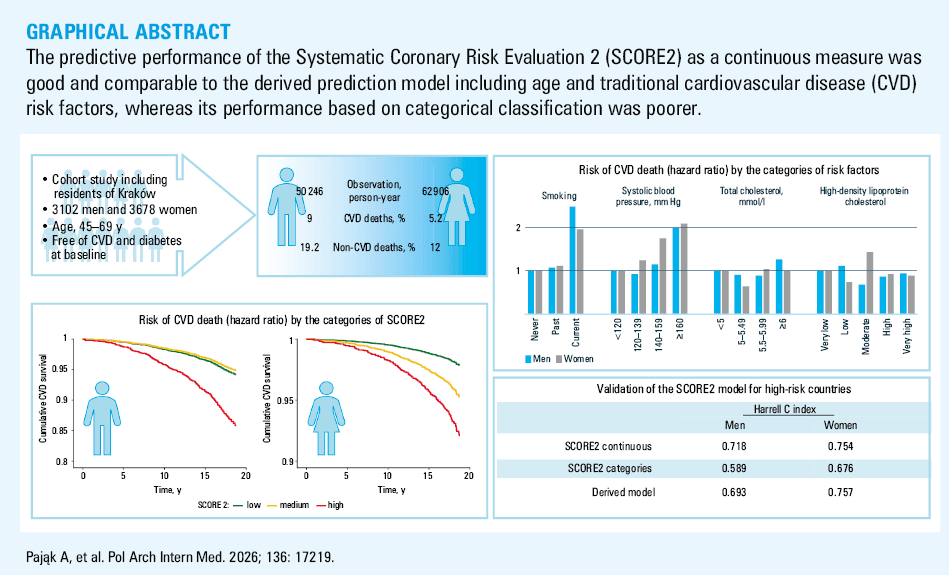
Objectives: The study aimed to evaluate the effect of traditional risk factors on CVD mortality, and to validate the prognostic performance of the Systematic Coronary Risk Evaluation 2 (SCORE2) model for the prediction of 18‑year risk of CVD death.
Patients and methods: Our cohort study included 6780 residents of Kraków (54% women), free of CVD and diabetes at baseline, recruited between 2002 and 2005. Mean (SD) baseline age was 57.2 (6.9) years for men and 56.6 (6.8) years for women.
Results: In 50 246 and 62 906 person‑years of follow‑up in men and women, respectively, cumulative CVD mortality was 9% in men and 5.2% in women, with competing (non‑CVD) mortality of 19.2% and 12%, respectively. Smoking and hypertension were strongly associated with CVD mortality, whereas associations with total cholesterol (TC) and high‑density lipoprotein cholesterol (HDL‑C) levels were weaker. A newly‑derived model including age, smoking, systolic blood pressure, TC, and HDL‑C achieved Harrell C index of 0.693 in men and 0.757 in women. The model including SCORE2 as a continuous variable showed similar discrimination (Harrell C index of 0.718 in men and 0.754 in women), while SCORE2 categories demonstrated poorer predictive performance (Harrell C index of 0.589 and 0.676, respectively).
Conclusions: Smoking and elevated blood pressure were confirmed as major long‑term predictors of CVD mortality. The prognostic performance of SCORE2 as a continuous measure was good and comparable to the derived prediction model including age and traditional risk factors. However, the predictive accuracy of SCORE2 categories was lower, particularly in men.
What's new?
The study provides a valuable long‑term evidence on mortality risk prediction in cardiovascular disease (CVD) in an urban Polish cohort followed for 18 years. In a changing risk factor landscape, the relative impact of cholesterol categories appears weaker than historically emphasized, whereas smoking and hypertension remain dominant drivers of long‑term CVD mortality. Although total cholesterol and high‑density lipoprotein cholesterol showed weaker associations with CVD mortality, the Systematic Coronary Risk Evaluation 2 (SCORE2) model performed well when applied as a continuous measure. However, the prediction performance of SCORE2 categories was less accurate, particularly in men. Therefore, clinicians should emphasize individualized, continuous risk assessment over categorical thresholds and tailor preventive interventions to population‑specific risk profiles to optimize long‑term cardiovascular outcomes.
Introduction
Prevention of cardiovascular disease (CVD), which aims to reduce exposure to well‑known CVD risk factors, is one of the most effective and economically justified health interventions allowing to reduce CVD incidence and mortality. However, the potential benefits from prevention are not equal. In general, the higher individual CVD risk, the greater health gain from reducing the risk factors. Current treatment recommendations and goals are based on individual risk assessment. Therefore, monitoring the quality of CVD risk prediction systems is essential for both public health and personalized preventive medicine.
The European Society of Cardiology (ESC) endorses the use of coronary heart disease risk prediction model called Systematic Coronary Risk Evaluation 2 (SCORE2), which is the 2021 modification of the original SCORE model introduced by the ESC in 2003.1-3 It aims to identify individuals at an elevated risk of CVD who are the most likely to benefit from preventive interventions. The SCORE2 algorithm integrates data on age, sex, smoking, systolic blood pressure (SBP), and total cholesterol (TC) and high‑density lipoprotein cholesterol (HDL‑C) levels. It was derived based on the analysis of pooled data from 45 cohorts across 13 countries (677 684 participants). It enables estimation of individual 10‑year risk of both fatal and nonfatal CVD events in men and women aged 40–69 years. To account for differences in CVD mortality rates across Europe, the SCORE2 model was calibrated for use in countries classified as low, moderate, high, and very high risk.
Good discriminatory performance of SCORE2 was originally documented in an external validation study of 25 additional cohorts in 15 European countries (1 133 181 individuals), including the Polish HAPIEE (Health, Alcohol and Psychosocial factors in Eastern Europe) cohort.2 Later, it was confirmed in independent observations from large cohorts in the United States, Canada, the Netherlands, and the United Kingdom (UK)4-7 and in the Malayan, mixed Asian population.8 However, the latter study concluded that, in comparison with SCORE2, the Framingham Risk Score, and the World Health Organization laboratory‑based risk score, the derived pooled cohort equation was the most clinically useful tool for predicting CVD risk.8 A call to use locally developed CVD risk scoring systems in the very high‑risk populations also emerged as a result of a Russian study.9 It was postulated that such scoring systems might beneficially change the distribution of risk assessment for the local health system.9
In all of the validation studies mentioned above, the final assessments of CVD risk were made for 10‑year or shorter follow‑up periods. Information on the predictive power of SCORE2 beyond 1 decade is scarce. Moreover, in high‑risk and very high‑risk countries, such as Poland,2,3 where the difference in cumulative mortality between the high- and low‑risk middle‑age individuals may begin to narrow more rapidly, the issues of discrimination and calibration of CVD risk prediction systems have not been sufficiently explored. External validation and evaluation of the recommended SCORE2 model performance in the high‑risk population over extended 18‑year follow‑up may provide important insights.
In this paper, using the observations from a well‑defined cohort from Poland, we aimed to evaluate the effect of individual risk factors included in the SCORE2 model on 18‑year CVD mortality, and validate the prognostic performance of the SCORE2 model for high‑risk countries in predicting the 18‑year risk of CVD death.
Patients and methods
This analysis utilized data from the Polish arm of the international HAPIEE study. Details of the study design and methodology have been published elsewhere.10,11 The study included a random sample of permanent residents of Kraków, aged 45–69 years, identified from the municipal residents’ registry. At baseline (2002–2005), a total of 10 727 men and women were examined, with a participation rate of 61%.
Data collection involved an initial home interview, during which information on health status, medical history, risk factors, lifestyle, diet, and psychosocial characteristics was obtained. Subsequently, the participants underwent a clinical examination, which included anthropometric measurements, blood pressure measurement, and venous blood sampling for fasting glucose and lipid level determination. The participants who provided a written consent were followed for mortality outcomes (censoring date, December 31, 2021).
For the present analysis, only the individuals free of CVD and diabetes at baseline were included. CVD was defined as a self‑reported history of hospitalization for myocardial infarction, angina pectoris, or stroke. The participants were classified as having diabetes if they reported being diagnosed by a doctor or had a fasting blood glucose concentration of 7 mmol/l or higher.
The study was approved by the Bioethics Committee of the Jagiellonian University Medical College (KE/99/03/B/284), and the patients gave their written informed consent to participate in the study.
Information on deaths and their causes was obtained from the National Population Registry, Statistics Poland, and by direct contact with families of the deceased participants. Deaths from ischemic heart disease (International Classification of Diseases, Tenth Revision [ICD10] codes I20–I25), cardiac failure (ICD10 codes, I11, I13, and I50), cerebrovascular disease (ICD10 codes, I60–I69), and peripheral artery disease (ICD10 codes, I70–I79) were classified as CVD deaths. Deaths from causes other than CVD were defined as competing events.
Statistical analysis
Descriptive statistics are presented according to sex. For normally distributed variables, means and SD were reported, and for variables not normally distributed, median and interquartile range (IQR) were used. Raw numbers and percentages were given for categorical variables.
The SCORE2 CVD risk was calculated using the original formula for high‑risk countries published by the SCORE2 Working Group and ESC Cardiovascular Risk Collaboration. SCORE2 risk categories were defined as follows: for individuals aged below 50 years—low, below 2.5%; medium, from 2.5% to below 7.5%; high, equal to or above 7.5%; for individuals aged 50 years or more—low, below 5%; medium, from 5% to below 10%; high, equal to or above 10%.2,3
Cumulative survival curves were constructed using the Cox proportional hazards model with adjustment for age. For cumulative mortality, 95% CI was estimated using nonparametric bootstrap resampling (1000 resamples; R package boot). For the purpose of this analysis, the participants were classified into risk factor categories reflecting current guidelines.3 HDL‑C levels were classified into the following categories: in men—very low, up to 1 mmol/l; low, 1.01–1.2 mmol/l; moderate, 1.21–1.4 mmol/l; high, 1.41–1.6 mmol/l; and very high, above 1.6 mmol/l; in women—very low, up to 1.3 mmol/l; low, 1.31–1.5 mmol/l; moderate, 1.51–1.6 mmol/l; high, 1.61–1.9 mmol/l; and very high, above 1.9 mmol/l.
Cause‑specific Cox proportional hazards models were constructed to estimate the association between covariates and the 18‑year risk of cardiovascular death, with deaths from non‑CVD causes treated as competing risks. The following risk factors were included in the models as predictors: age, SBP, TC, HDL‑C, and smoking status. HDL‑C levels were modeled using restricted cubic splines with 3 degrees of freedom to allow for nonlinear associations with cardiovascular mortality. The choice of 3 degrees of freedom was made to balance model flexibility while minimizing the risk of overfitting. The global Grambsch and Therneau test based on Schoenfeld residuals12 was applied to test the proportional hazards assumption. Since the assumption was not met for the smoking variable, smoking was included in the prediction models as a stratification factor.
For multivariable models, results were presented as hazard ratios (HRs) per 1‑unit increase of each variable, with the exception of SBP, for which HR was recalculated for a 10‑mm Hg increase.
Discrimination (a measure of how accurately the participants who will experience fatal CVD are separated from those who will not) was assessed by Harrel C index corrected for competing risks.13 The Wald test of coefficients was used to determine statistical significance. A P value below 0.05 was deemed significant. The relationship between the predicted and observed risk of death was presented by deciles of predicted risk. The Nam–D’Agostino statistic, a goodness‑of‑fit test, was applied to evaluate how well the predicted probabilities of an event matched the observed outcomes. P values above the significance level in the Nam–D’Agostino test indicated better calibration.
Calibration of the SCORE2 and derived prediction model was assessed by comparing the predicted probabilities from the constructed models with the observed events, accounting for competing risks using cumulative incidence functions.
IBM SPSS Statistics for Windows, version 29 (IBM Corp., Armonk, New York, United States) was used for calculation of descriptive statistics and construction of cumulative survival curves.14
The statistical software R, version 4.3.3 (R Foundation for Statistical Computing, Vienna, Austria15) was used for survival analyses (cmprsk and survival libraries, coxExtensions package).16
Results
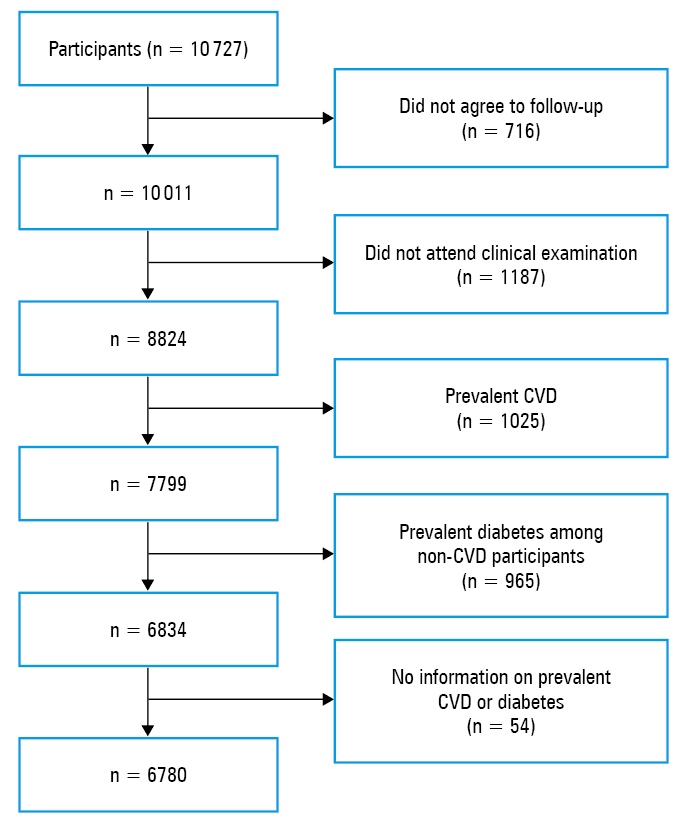
There were 4290 men and 4534 women who participated in the clinical examination and agreed to participate in follow‑up. Of these, 643 men and 382 women were excluded from the analysis due to prevalent CVD, and further 528 men and 437 women were excluded due to prevalent diabetes among non‑CVD participants. Additionally, 17 men and 37 women were excluded due to missing information on prevalent CVD or diabetes. Finally, 3102 men and 3678 women were included in the present analysis (Figure 1). Missing data were infrequent and differed by variable (n = 17 for smoking status and n = 24 for SBP). No missing values were present for TC, and a single missing value was found for HDL‑C. The SCORE2 value could not be calculated for 42 participants due to missing components. Consequently, the number of participants not included in the multivariable models was further reduced by 0.6%–0.7%. The median (IQR) follow‑up time was 17.9 (17–18.7) years in women and 18 (17.8–18.7) years in men. The analysis included 50 246 person‑years for men and 62 906 person‑years for women.
Abbreviations: CVD, cardiovascular disease
Mean (SD) age at baseline was slightly higher in men than in women, at 57.2 (6.9) vs 56.6 (6.8) years, respectively. Descriptive statistics for the variables used in the analysis are presented according to sex in Table 1. In men, the observed cumulative mortality was 9% (95% CI, 8.1–10.1) for CVD and 19.2% (95% CI, 17.9–20.6) for competing events. In women, the corresponding rates were 5.2% (95% CI, 4.6–6) and 12% (95% CI, 11–13.1).
Parameter | Men (n = 3102)a | Women (n = 3678)a | |
Data are presented as number and percentage.
a Not all numbers sum up to a total number of patients and not all percentage values sum up to 100% due to single cases of missing data described in the Results section.
b HDL‑C categories: men—very low ≤1 mmol/l; low, 1.01–1.2 mmol/l; moderate, 1.21–1.4 mmol/l; high, 1.41–1.6 mmol/l; and very high >1.6 mmol/l; women—very low ≤1.3 mmol/l; low, 1.31–1.5 mmol/l; moderate, 1.51–1.6 mmol/l; high, 1.61–1.9 mmol/l; and very high >1.9 mmol/l
c SCORE2 categories: age <50 y—low <2.5%, medium, 2.5% to <7.5%, and high, >7.5%; age >50y—low <5%, medium, 5% to <10%, and high >10%
Abbreviations: HDL‑C, high‑density lipoprotein cholesterol; SBP, systolic blood pressure; SCORE2, Systematic Coronary Risk Evaluation 2; TC, total cholesterol; others, see Figure 1 | |||
Age, y | 45–54 | 1281 (41.3) | 1682 (45.7) |
55–64 | 1266 (40.8) | 1429 (38.9) | |
65–70 | 555 (17.9) | 567 (15.4) | |
Smoking | Current | 1099 (35.6) | 1030 (28.1) |
Past | 1033 (33.4) | 763 (20.8) | |
Never | 960 (31) | 1878 (51.1) | |
SBP, mm Hg | <120 | 383 (12.4) | 1047 (28.5) |
120–139 | 1250 (40.4) | 1432 (39.1) | |
140–159 | 977 (31.6) | 795 (21.7) | |
>160 | 481 (15.6) | 391 (10.7) | |
TC, mmol/l | <5 | 689 (22.2) | 628 (17.1) |
5–5.49 | 594 (19.1) | 681 (18.5) | |
5.5–5.99 | 579 (18.7) | 752 (20.4) | |
>6 | 1240 (40) | 1617 (44) | |
HDL‑Cb | Very low | 409 (13.2) | 906 (24.6) |
Low | 780 (25.1) | 808 (22) | |
Moderate | 835 (27) | 402 (10.9) | |
High | 516 (16.6) | 848 (23.1) | |
Very high | 562 (18.1) | 713 (19.4) | |
SCORE2c | Low | 388 (12.6) | 1605 (43.9) |
Medium | 1322 (42.9) | 1316 (36) | |
High | 1371 (44.5) | 736 (20.1) | |
CVD deaths | 280 (9) | 193 (5.2) | |
Competing deaths | 596 (19.2) | 441 (12) | |
Risk factors and cardiovascular disease mortality
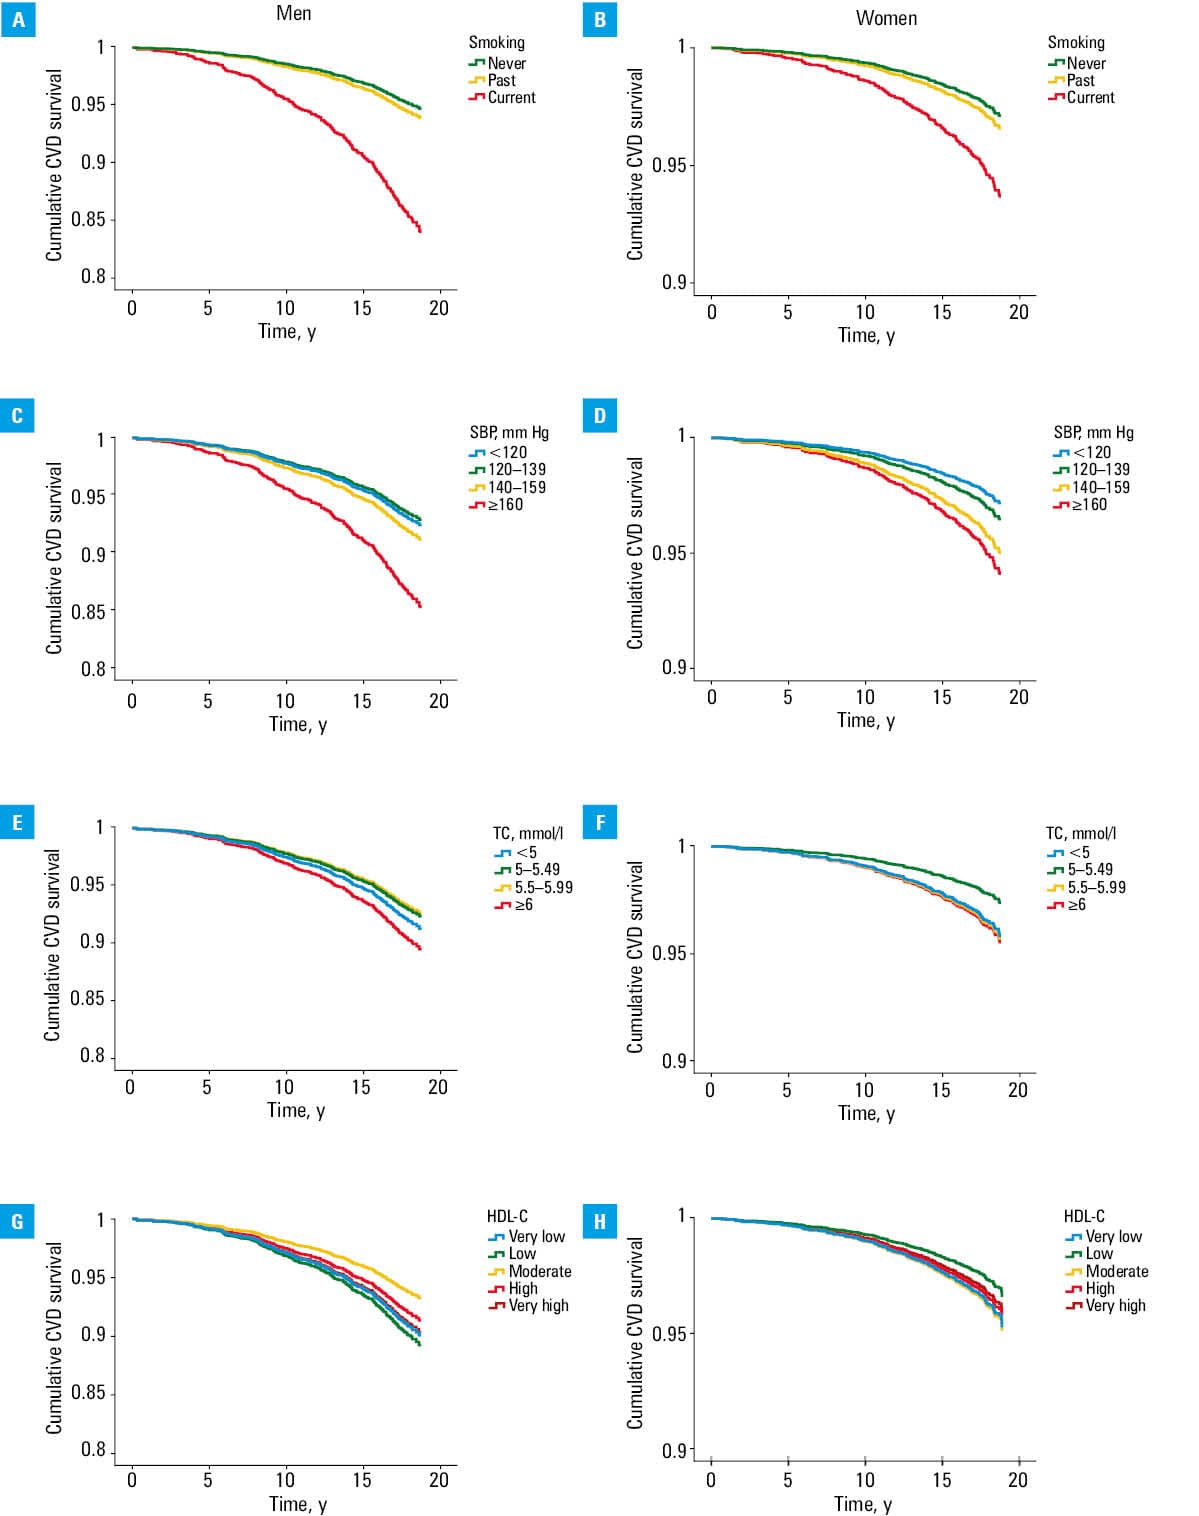
The age‑adjusted survival curves, as a graphic visualization of the relation between the risk of CVD death and time of observation for traditional risk factors in men and women, are presented in Figure 2, and the age‑adjusted CVD mortality risk by the categories of risk factors are given in Table 2. In general, high exposure to each risk factor is related to increasingly higher risk of CVD death. However, some peculiar relationships are worth highlighting.
Parameter | Men | Women | |||
HR | 95% CI | HR | 95% CI | ||
a HDL‑C categories: men—very low <1 mmol/l; low, 1.01–1.2 mmol/l; moderate, 1.21–1.4 mmol/l; high, 1.41–1.6 mmol/l; and very high >1.6 mmol/l; women—very low <1.3 mmol/l; low, 1.31–1.5 mmol/l; moderate, 1.51–1.6 mmol/l; high, 1.61–1.9 mmol/l; and very high >1.9 mmol/l
Abbreviations: HR, hazard ratio; others, see Table 1 | |||||
Smoking | Never | 1 | – | 1 | – |
Past | 1.08 | 0.78–1.5 | 1.12 | 0.77–1.63 | |
Current | 2.47 | 1.84–3.31 | 1.95 | 1.38–2.75 | |
SBP, mm Hg | <120 | 1 | – | 1 | – |
120–139 | 0.92 | 0.58–1.46 | 1.25 | 0.77–2.02 | |
140–159 | 1.15 | 0.73–1.83 | 1.75 | 1.05–2.91 | |
≥160 | 2 | 1.25–3.19 | 2.09 | 1.21–3.63 | |
TC, mmol/l | <5 | 1 | – | 1 | – |
5–5.49 | 0.91 | 0.62–1.32 | 0.65 | 0.38–1.12 | |
5.5–5.99 | 0.89 | 0.60–1.31 | 1.04 | 0.64–1.68 | |
≥6 | 1.26 | 0.93–1.7 | 1.01 | 0.67–1.54 | |
HDL‑Ca | Very low | 1 | – | 1 | – |
Low | 1.11 | 0.76–1.62 | 0.75 | 0.49–1.15 | |
Moderate | 0.69 | 0.46–1.04 | 1.43 | 0.92–2.24 | |
High | 0.88 | 0.57–1.34 | 0.92 | 0.61–1.37 | |
Very high | 0.95 | 0.62–1.44 | 0.89 | 0.58–1.38 | |
First, while the participants who continued smoking at the age of 45 years had increasingly higher risk than never‑smokers throughout the whole time of observation, the survival curves for the past smokers were very close to those of the never‑smokers. After adjustment for age, current smoking was related to approximately twice the risk of CVD death as never smoking, and there was no significant difference between the never- and past smokers.
Then, while in our observations there was an increase in the average estimated CVD mortality risk with the increase of SBP in women, in men the lowest estimate was found in the participants with SBP between 120 mm Hg and 139 mm Hg (high normal BP). The survival curve for the participants with SBP lower than 120 mm Hg was very close to that for the participants with SBP between 140 mm Hg and 159 mm Hg (first‑degree hypertension).
The associations between CVD mortality risk and TC and HDL‑C categories were not significant. However, the average risk estimates indicated that in men, the lowest risk of CVD death was found in the 2 groups with TC concentration between 5 and 5.99 mmol/l, in which the survival curves were very close to each other. In women, the lowest risk was found in the group with TC values of 5–5.49 mmol/l. There was a U‑shaped relation between HDL‑C and CVD risk in men, in whom the lowest risk was found in the group with HDL‑C of 1.21–1.4 mmol/l (moderate). Based on average risk estimates, the relation between CVD risk and HDL‑C showed no clear pattern in women, in whom the lowest CVD risk was found in the individuals with HDL‑C of 1.31–1.5 mmol/l (low), while the group with the HDL‑C level of 1.51–1.6 mmol/l had the highest risk. However, in the multivariable analysis, after adjustment for age and the other risk factors, the relation with CVD risk of death was significant for TC in women and for HDL‑C in men (Table 3).
Parameter | Men | Women | ||
HR | 95% CI | HR | 95% CI | |
a Risk factors: SPB, TC, HDL‑C, smoking as a stratification factor
| ||||
Model 1, SCORE2 continuous | 1.11 | 1.1–1.13 | 1.13 | 1.11–1.14 |
Harrell C index | 0.718 | 0.754 | ||
Nam–d’Agostino χ2; df (P) | 13.8; 8 (0.09) | 9.63; 8 (0.29) | ||
Model 2, SCORE2 categories | ||||
Low (ref.) | 1 | – | 1 | – |
Medium | 1.03 | 0.58–1.82 | 3.84 | 2.38–6.22 |
High | 4.16 | 2.47–7.01 | 10.42 | 6.57–16.55 |
Harrell C index | 0.589 | 0.676 | ||
Nam–d’Agostino χ2; df (P) | 14.4; 1 (<0.001) | 6.17; 1 (0.01) | ||
Model 3, age + risk factorsa | ||||
Age | 1.09 | 1.07–1.11 | 1.14 | 1.11–1.18 |
TC | 1.1 | 0.99–1.22 | 1.16 | 1.001–1.35 |
HDL‑C (linear) | 0.23 | 0.1–0.51 | 0.7 | 0.22–1.88 |
HDL‑C (nonlinear) | 5.84 | 2.41–14.2 | 1.35 | 0.4–4.55 |
SBP (per 10‑mm Hg increase) | 1.15 | 1.09–1.22 | 1.09 | 1.03–1.17 |
Harrell C index | 0.693 | 0.757 | ||
Nam–d’Agostino χ2; df (P) | 9.3; 8 (0.32) | 5.2; 8 (0.13) | ||
In women, there was a dose‑dependent relationship for the categories of SCORE2, but in men the survival curves were very close for the SCORE2 categories of low and medium CVD risk (Figure 3). This pattern was confirmed in the Cox proportional hazards analysis (Model 2; Table 3).
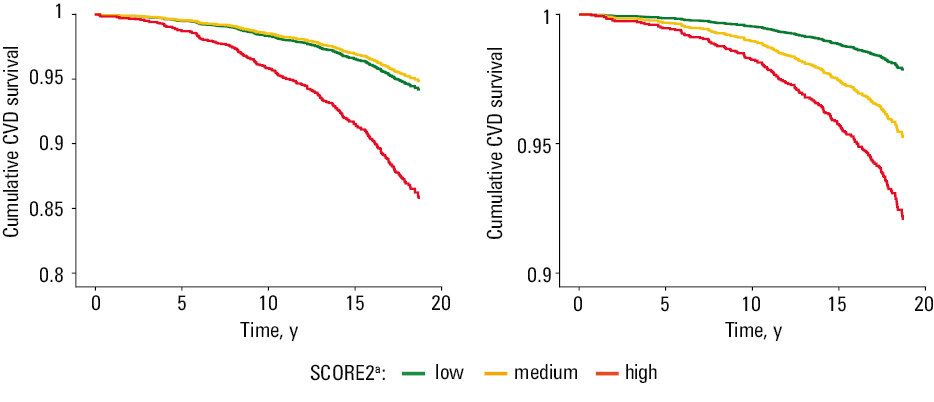
a For age <50 y: low <2.5%; medium, from 2.5% to <7.5%; high >7.5%; for age >50 y: low <5%; medium, from 5% to <10%; high >10%
Prediction models
Prognostic performance of the SCORE2 and of the derived models, which included individual age and risk factors, is presented in Table 3. In all models, the predictive discriminatory performance assessed by the Harrell C index was better in women than in men. Discrimination power of the model that included SCORE2 as a continuous variable (Model 1) was better than that of Model 2, which included SCORE2 categories (Harrell C index, 0.589 in men and 0.676 in women). The derived Model 3, which included age, smoking as stratification factor (current smokers vs never‑smokers and past smokers), SBP, TC, and HDL‑C, had better discrimination power than Model 2 with SCORE2 categories (Harrell C index, 0.693 in men and 0.757 in women), but in men it was worse than in Model 1 (SCORE2 as continuous variable). The results of the Nam–D’Agostino test confirmed that the prediction of Model 2 (SCORE2 categories as an independent variable) was poorer, but both SCORE2 and derived Model 3 were well calibrated and provided reliable estimates of survival outcomes.
The comparison of predicted vs observed risk of CVD death for SCORE2 as a continuous measure (Model 1) and the derived model, which included individual age and risk factors (Model 3), is presented by deciles of predicted probabilities in Figure 4. Prediction by SCORE2 showed slightly greater variation than the prediction by the derived Model 3 (Figure 4).
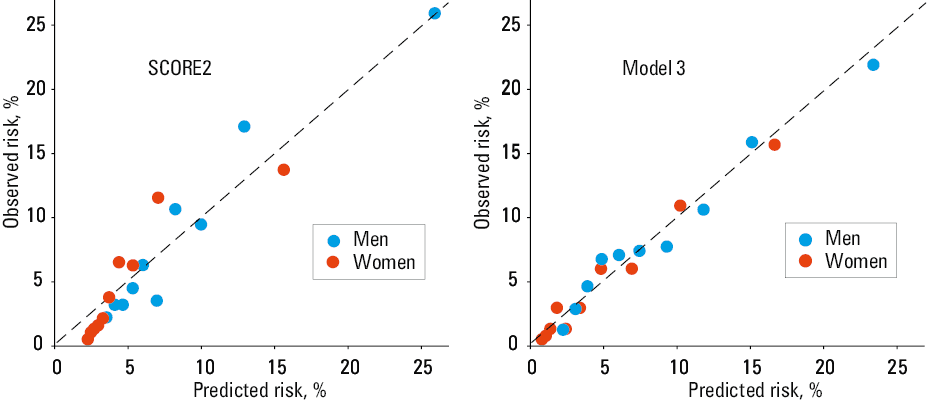
Abbreviations: see Table 1
Discussion
In the middle‑age sample from the urban Polish population, traditional risk factors were related to an 18‑year risk of CVD death, but commonly accepted cutoff points for hypercholesterolemia were less predictive of high CVD mortality risk. The SCORE2 algorithm appeared to have a good prediction performance. The discriminatory performance of SCORE2 and the derived prediction model, which included individual age and traditional risk factors, was better in women than in men. In comparison with the derived prediction model, SCORE2 had slightly stronger discriminatory performance in men but calibration against observed CVD mortality risk across the range of prediction was slightly weaker. The discrimination power of SCORE2 categories was poorer, particularly in men, in whom the observed CVD mortality risk did not differ between the SCORE2 categories of moderate and low risk.
Although the differences in study populations, follow‑up duration, predictor sets, and outcome definitions may limit direct comparisons of Harrel C index across studies, our findings are generally consistent with previous external validations of SCORE2. The discriminatory performance of SCORE2 in our study was within the range reported for other cohorts (Harrell C index, 0.65–0.81).2,6 Similarly to Dutch, Canadian, and United States cohorts, discrimination power of SCORE2 was better for women than for men.4-6 However, in our study, the differences between the predicted and observed CVD mortality risk were smaller in both sexes. We did not observe sex‑related differences in risk estimation, as reported in the UK EPIC Norfolk cohort,7 or large overestimation in both sexes, as in the Canadian primary care cohort.5 The latter difference could partially be explained by shorter, only 5‑year follow‑up in the Canadian study. Further, in our observation by decile of predicted CVD mortality risk, the differences between SCORE2‑predicted and the observed risk were smaller than in other cohorts. Unlike the observation in the EPIC Norfolk cohort,7 we did not find overestimation in men and underestimation in women by deciles of predicted probabilities or underestimation over the whole range of predicted risk, as in a large Dutch study on primary care patients.17 Unlike observation in the Canadian cohort with shorter follow‑up,5 we did not see a clear overestimation of the predicted risk in either sex by SCORE2 categories and by deciles of the predicted risk. Better calibration of SCORE2 and the derived model in our cohort may be explained by its ethnic homogeneity and relatively uniform socioeconomic status, as previous studies showed that SCORE2 tends to underpredict CVD risk populations with lower socioeconomic status and specific ethnic backgrounds.6 Further, some of the observed discrepancies between our results and the previous studies could be explained by the site of the studies that were conducted in low‑risk populations and utilized the SCORE2 algorithm calibrated specifically for low‑risk countries.
Our findings on the relations of CVD risk with smoking and SBP are in line with current recommendations.3,18 Similar CVD mortality risk observed among former and never smokers should be interpreted in light of long follow‑up and the timing of smoking assessment. Evidence shows that maintaining long‑term former smoker status reduces cardiovascular risk progressively after cessation, and may approach that of never smokers after long‑term abstinence. Our findings therefore likely reflect the lasting benefits of smoking cessation.19,20
However, in the multivariable analysis we confirmed a significant relation between CVD risk and TC only in women, and between CVD risk and HDL‑C only in men. Associations of low SBP and low TC with elevated CVD risk are usually explained by the presence of undetected disease at baseline. While this effect is possible, it is unlikely to fully account for the observed difference in CVD mortality risk, as CVD survival curves were similar across all of SBP and TC categories during the first years of follow‑up.
The nonlinear relationship between CVD risk and HDL‑C confirms the common opinion that low HDL‑C level is inversely associated with CVD risk but very high HDL‑C levels may indicate increased risk.3,21 Our results support the opinion that HDL‑C is a useful biomarker for refining risk estimation,3 but they do not support the previous findings suggesting a beneficial effect of a HDL‑C level up to 1.6 mmol/l (60 mg/dl), which is still present in some recommendations available in public domain.22
In addition to traditional risk factors, emerging biomarkers, such as lipoprotein(a) (Lp[a]), have received increasing attention due to their genetically determined contribution to CVD risk. Recent evidence suggests that Lp(a) may interact with traditional risk factors, including smoking and dyslipidemia, potentially refining individual risk prediction.23-25 While this marker holds promise for improving risk stratification, current European guidelines3 continue to recommend SCORE2 as the primary tool for population‑level assessment.
Limitations
There are several limitations to the interpretation of our study. First, although the sample was randomly selected from the residents of Kraków—a city with approximately 780 000 inhabitants—it cannot be considered representative of the entire Polish population. Second, there is evidence that the final analysis included the healthier part of the population, as nonparticipants were at a higher risk of death.26 Third, the number of participants with the lowest and the highest blood TC and HDL‑C levels was small, which could affect our findings on the association of CVD mortality risk with blood lipids. Further, the analysis was limited to risk factors included in the SCORE2 algorithm. Other known CVD risk factors were not included in order to allow a direct comparison with SCORE2, and the findings should be interpreted in the context of this restricted set of predictors. Although SCORE2 appeared to predict the 18‑year risk of CVD death, the comparisons between SCORE2 and the derived risk prediction model should be interpreted with caution, as SCORE2 was originally developed to predict the risk of fatal and nonfatal CVD events in a 10‑year period. Finally, for the derived prediction model (Model 3), we were unable to replicate the original construction of SCORE2 due to data‑specific limitations, that is, relations between smoking and CVD risk did not fulfil the assumption of proportional hazards, and the relation between HDL‑C and CVD risk was not linear. Furthermore, there was no need to include interactions in the Model 3, as they were not significant.
Strengths
The study has several strengths. First, it was conducted on a well‑defined cohort from a high‑risk country, with data collected using internationally standardized methods. The studied cohort is ethnically homogenous and characterized by high proportion of participants with university education. Further, the prevalence of smoking, hypercholesterolemia and hypertension, and distribution of SCORE categories was similar to other big Polish cities.27 We included observations from 18 years of follow‑up, and registered over 470 CVD deaths and over 1000 competing fatal events, which ensured high statistical power. Finally, the study provides valuable validation and insights into the performance of SCORE2 in a real‑world high‑CVD‑risk setting.
Conclusions
We confirmed strong and consistent associations of smoking and BP with 18‑year CVD mortality risk, whereas the effects of TC and HDL‑C were less pronounced. We documented good prognostic performance of the SCORE2 risk model for high‑risk countries in predicting 18‑year risk of CVD mortality. The SCORE2 algorithm demonstrated predictive performance comparable to the derived model that included age and traditional risk factors. However, risk classification based on the SCORE2 categories showed poorer predictive performance, particularly in men, among whom the observed CVD mortality was nearly identical in the low and medium‑risk groups. This suggests that implementing the SCORE2 model in general practice in Poland could lead to overtreatment of some men who are in fact not at a high risk.
From a clinical perspective, the limited prognostic performance of the SCORE2 risk categories in men raises concerns regarding their use as strict decision thresholds in Polish clinical practice. The similarity in observed CVD mortality between the low- and medium‑risk groups in men suggests that categorical risk stratification may insufficiently capture true long‑term risk in this population. This may result in misclassification and potentially unnecessary pharmacological intervention in some men, while others at a genuinely elevated risk may remain undertreated. Our findings support the use of SCORE2 primarily as a continuous risk estimation tool rather than a categorical classifier,28 and underscore the need for clinical judgment that incorporates individual risk trajectories, other risk modifiers, and population‑specific epidemiologic context.
- De Backer G, Ambrosioni E, Borch‑Johnsen K, et al. European guidelines on cardiovascular disease prevention in clinical practice. Third Joint Task Force of European and Other Societies on Cardiovascular Disease Prevention in Clinical Practice. Eur Heart J. 2003; 24: 1601‑1610. | Crossref
- SCORE2 Working Group and ESC Cardiovascular Risk Collaboration. SCORE2 risk prediction algorithms: new models to estimate 10‑year risk of cardiovascular disease in Europe. Eur Heart J. 2021; 42: 2439‑2454. | Crossref
- Visseren FLJ, Mach F, Smulders YM, et al. 2021 ESC Guidelines on cardiovascular disease prevention in clinical practice. Eur Heart J. 2021; 42: 3227‑3337. | Crossref
- Medina‑Inojosa BJ, Medina‑Inojosa JR, Sheffeh MA, et al. Validation of the European Society of Cardiology Systematic Coronary Risk Evaluation 2 prediction algorithms in a non‑European (United States) contemporary, community‑based historical cohort. Circulation. 2022; 146: Suppl 1. abstract 13342. | Crossref
- Sud M, Sivaswamy A, Austin PC, et al. Validation of the European SCORE2 models in a Canadian primary care cohort. Eur J Prev Cardiol. 2024; 31: 668‑676. | Crossref
ARTICLE INFORMATION