
Association between blood pressure variability and frailty in older people with hypertension
Key words: blood pressure variability, frailty, hypertension, older adults

 CC BY 4.0
Association between blood pressure variability and frailty in older people with hypertension
CC BY 4.0
Introduction: Frailty is a common condition in older hypertensive adults, and it is associated with an increased risk of adverse outcomes. Blood pressure variability (BPV) is an independent cardiovascular risk factor, but its relationship with frailty remains poorly understood, especially in outpatients.
Objectives: We aimed to investigate the association between short‑term 24‑hour BPV and frailty in a cohort of older hypertensive outpatients.
Patients and methods: In this cross‑sectional study, 184 hypertensive outpatients aged at least 75 years underwent frailty assessment using a 40‑item frailty accumulation index derived from comprehensive geriatric assessment and 24‑hour ambulatory BP monitoring (ABPM). The participants were categorized as nonfrail, prefrail, or frail, and short‑term BPV was quantified using multiple indices. Multiple regression analysis was used to identify associations between BPV and frailty status, and adjusted β estimates were reported.
Results: Mean (SD) age of the participants was 81.76 (4.32) years, and 68% were women. Of the entire group, 63 patients (34.2%) were nonfrail, 79 (42.9%) prefrail, and 42 (22.8%) frail. Frailty directly correlated with nocturnal diastolic BPV. In adjusted analyses, nocturnal diastolic BP was strongly associated with frailty (β = 0.076; P = 0.04), and systolic dipping showed a marked negative association with the frailty index (β = –0.17; P = 0.04).
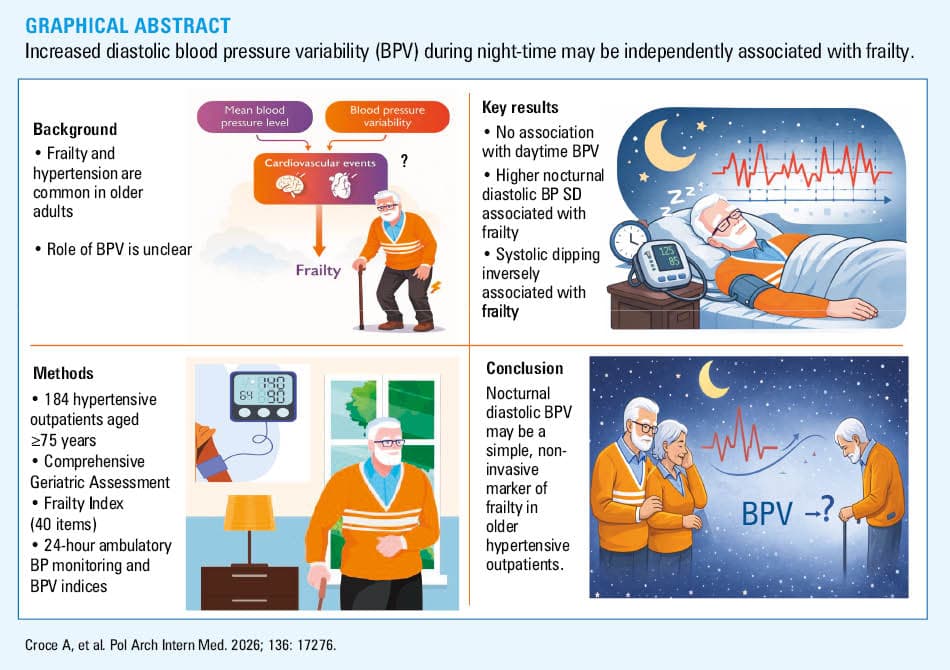
Conclusions: Nocturnal but not diurnal BPV is associated with frailty in older hypertensive outpatients. These findings support the potential clinical value of BPV in geriatric care as a noninvasive marker of physiological vulnerability, easy to obtain whenever ABPM is required for hypertension management. Further studies are needed to clarify causality and define the potential of BPV assessment and modulation in older patients.
Introduction
Frailty is a clinically identifiable state of diminished physiological reserve and ability to maintain homeostasis, leading to increased vulnerability and adverse health events.1 It is particularly prevalent among community‑dwelling individuals, ranging from 11% in those aged 50–59 years to 51% in those aged 90 years or more.2
Arterial hypertension, a major cardiovascular risk factor, is particularly frequent among older adults, with its prevalence increasing significantly with age.3,4 As a result, frailty is commonly observed in hypertensive patients, while hypertension is more frequent among frail individuals than in their fitter counterparts.5
The prevalence of frailty in hypertensive patients varies widely, from 14% to 80%, depending on population characteristics and the methods used to assess frailty.5,6 Frail hypertensive patients represent a distinct population in geriatric care, often presenting a heightened cardiovascular risk due to age‑related risk factors and pre‑existing organ damage.7 However, these patients are also more prone to treatment‑related adverse events and may have shorter life expectancy, complicating diagnostic and therapeutic decision‑making.8
However, the management of hypertension in older and frail patients has received little attention in the literature, and mostly represents an unresolved clinical question, as underlined in the European Society of Hypertension guidelines that list this issue among the “gaps in evidence.”3
Indeed, older and frail patients often do not meet the inclusion criteria of clinical trials, and are therefore excluded from study populations.9 Thus, there is a lack of sufficient evidence to support tailored therapeutic recommendations for these patient subgroups, and an observational study demonstrated that hypertension in older adults is often poorly addressed.10
Another feature of blood pressure (BP) values, which seems to be enhanced in frail patients, is BP variability (BPV) over time.11 Under physiological conditions, these BP variations largely represent a response to environmental stimuli and challenges of daily life aimed at maintaining cardiovascular homeostasis. However, increased BPV may also reflect alterations in cardiovascular regulatory mechanisms or underlying pathological conditions, and may be a source of damage to the cardiovascular system. In fact, previous studies have shown an independent and adverse prognostic impact of increased BPV both in younger and older patients.12,13
Moreover, evidence indicates that increased BPV is associated with age, that is, short‑term diastolic BPV independently predicts cardiovascular mortality in hypertensive individuals across all age groups, while systolic BPV seems a particularly strong predictor of mortality in young adults.13,14 This relationship is likely mediated by increased arterial stiffness.15
In theory, increased BPV may reflect a generalized frail condition, representing a marker of impaired BP homeostatic regulation and / or accelerated arterial aging. However, evidence linking BPV and frailty remains limited. Long‑term studies have shown that elevated visit‑to‑visit systolic BPV, independent of mean BP, is associated with an increased risk of incident frailty in healthy older adults.16,17 In contrast, evidence on short‑term BPV is scarce. In a Chinese cohort of hospitalized hypertensive patients, increased BPV was associated with frailty assessed by a 38‑item frailty index.18 These findings, however, have not been reproduced in outpatient populations or in other ethnic groups.
Considering the above, our study aimed to explore the association between short‑term 24‑hour BPV and frailty in a cohort of older hypertensive outpatients.
Patients and methods
Participants and study design
In this cross‑sectional study, we screened consecutive older hypertensive outpatients attending the San Luca Hospital (Istituto Auxologico Italiano) hypertension clinic in Milan (Italy) between May 2022 and August 2024. The inclusion criteria were a diagnosis of hypertension according to the European Society of Hypertension criteria,19 age of 75 years or greater, and provision of written informed consent. The exclusion criteria comprised life expectancy shorter than 6 months and overt dementia.
The study was approved by the Istituto Auxologico Italiano Ethics Committee (2022_05_17_07) and conducted in accordance with the ethical principles of the Declaration of Helsinki (2013 revision).
Clinical data collection
To describe the population and to assess if any confounders could be recognized, we recorded sociodemographic and medical history data, with particular regard to comorbidities, cardiovascular risk factors, and hypertension‑related organ damage. Age, sex, smoking status, body mass index, educational level, and concomitant medication were recorded.
All patients underwent a comprehensive geriatric assessment (CGA), a multidimensional evaluation encompassing medical, functional, cognitive, and psychosocial domains. Comorbidity was assessed using the Charlson Comorbidity Index, a widely used tool that has been extensively studied and validated as a predictor of mortality in the geriatric population.20 This was done during the study visit based on the information provided by the patient and clinical documentation. Sensory deficits (vision and hearing) and their corrections were identified and recorded. Functional status was assessed with multiple tools: the Basic Activities of Daily Life,21 the Instrumental Activities of Daily Life,22 the handgrip strength, and the Short Physical Performance Battery (SPPB). The SPPB combines gait speed, chair‑stand, and balance tests, yielding a score from 0 (worst performance) to 12 (best performance).23
Cognitive function was evaluated using the Mini‑Mental State Examination (MMSE), a 30‑point test covering multiple cognitive domains.24 Age‑adjusted MMSE scores25 were also reported. Sleep disorders were examined based on clinical assessment.
Frailty index measurements
In our study, the frailty index (FI) was created, according to the Rockwood criteria,26 from the Italian version (Italian Frailty Index), and in line with a recently validated version by Abete et al.27 For this study, an original FI was computed using 40 variables obtained with the CGA (Supplementary material, Table S1). Binary variables were coded as 0 in the absence of a deficit and 1 in its presence. For selected variables, an intermediate value of 0.5 was assigned to capture gradation in impairment. For each participant, the FI was calculated as the sum of deficits divided by the total number of deficits assessed, yielding a continuous score ranging from 0 to 1. The participants were then categorized into 3 groups, based on their FI, as frail (FI ≥0.25), prefrail (FI from >0.25 to ≤0.15), and nonfrail (FI <0.15).28 The FI was calculated for the participants with data available for at least 30 items; those with more than 10 missing items were excluded (n = 10).
Blood pressure measurement and variability estimation
Office BP was assessed using a validated automated oscillometric device (UM‑211; A&D Company Limited, Kitamoto, Japan). If the between‑arm difference (verified at the first simultaneous measurement on both arms) in systolic BP (SBP) was below 10 mm Hg, then the nondominant arm was used for all subsequent BP assessments; otherwise, the arm with the higher systolic value was considered for BP measurement. An appropriate cuff size was used. After at least 5 minutes of rest, 3 BP readings were recorded at intervals of 1 minute with the participant being seated in a quiet room. The average of the second and third measurements was used for the analyses. BP was also assessed with the participant standing for 1 and 3 minutes. Orthostatic hypotension was diagnosed if a drop of 20 mm Hg in SBP or a drop of 10 mm Hg in diastolic BP (DBP) was recorded within 2 to 5 minutes of standing, or if symptoms appeared.29 The data were recorded by the investigator in a standardized data collection form.
All patients underwent a 24‑hour ambulatory BP monitoring (ABPM), performed with a validated oscillometric device (Model TM‑2440, A&D). BP was measured at 15‑minute intervals during daytime (7:00 AM to 10:00 PM) and at 30‑minute intervals during night‑time (10:00 PM to 7:00 AM). The recordings were considered invalid if less than 70% of valid readings were available. All valid ambulatory BP readings were used to calculate 24‑hour, diurnal, and nocturnal BP arithmetic mean values as well as variability indices. Mean BP values indicated the average levels of SBP and DBP. Variability of SBP and DBP was estimated using the following metrics: the average real variability (ARV), the coefficient of variation (CV), SD, and weighted SD for SBP and DBP.30
In detail, ARV is the mean of absolute change between successive BP readings and was calculated using the following formula:
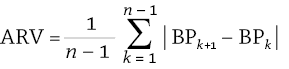
where n is the total valid number of blood pressure readings, and BPk and BPk+1 denote 2 consecutive BP measurements.31
Data were extracted to calculate SD. Weighted SD over 24 hours was calculated with the following formula: Weighted SD = (SD of diurnal BP × daytime + SD of nocturnal BP × night‑time) / Total recording length.32 CV was calculated as 100 × SD/mean SBP and DBP.11 Nocturnal BP fall (dipping) was calculated as percentage with the formula presented below.

Statistical analysis
Continuous variables were expressed as mean (SD) or median (interquartile range [IQR]) according to their distribution, while categorical variables were expressed as absolute and relative frequencies. The Shapiro–Wilk test and QQ‑plot were used to evaluate distribution normality.
In the descriptive section, we reported the sociodemographic and clinical characteristics in the 3 categories of frail patients (frail, prefrail, and nonfrail). Differences among the groups were evaluated with 1‑way analysis of variance (or the Kruskal–Wallis test for non‑normally distributed data) for continuous characteristics and the χ2 test (the Fisher test when needed) for categorical ones. Subsequently, a linear regression model was applied to verify the association between FI and each BPV measure adjusting for several potential confounders selected based on descriptive results and clinical knowledge and excluding covariates used for calculating FI. In particular, β-blockers and calcium channel blockers (CCBs) have been shown to influence BPV indices. A diagnosis of insomnia may affect both night‑time BPV and BP dipping patterns, so it was also accounted for. Age and sex were included as general demographic variables known to be associated with both frailty and BPV, while mean 24‑hour SBP is known to correlate with BPV. In addition, acute events, such as falls or hospitalizations occurring in the previous year may be associated with frailty. For each BPV index, we reported the adjusted β parameter estimate with its corresponding SE and P value.
All statistical tests were 2‑tailed and P value below 0.05 was considered significant. The analyses were performed using SAS statistical package, version 9.4.
Results
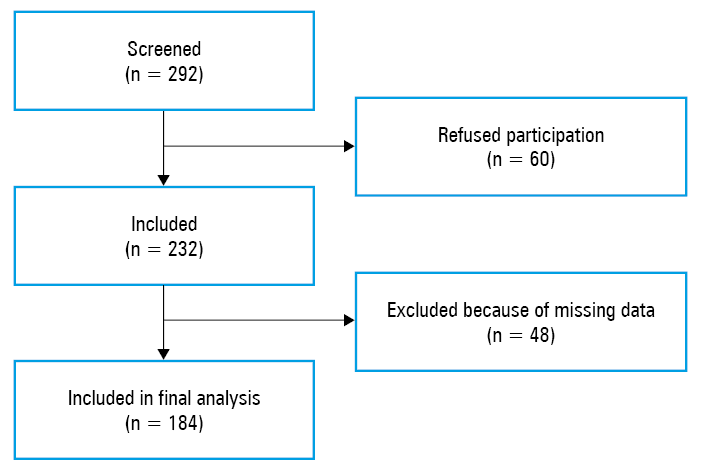
A total of 292 patients were screened for eligibility. Of these, 232 provided informed consent to participate in the study. Subsequently, 48 patients were excluded due to incomplete data required for the calculation of the FI and / or 24‑hour ABPM. The final analytical sample included 184 participants. The flowchart detailing participant selection is shown in Figure 1.
The study cohort included 58 men (32%) and 126 women (68%), at a mean (SD) age of 81.76 (4.32) years. The majority of the participants exhibited a good functional and cognitive profile (median [IQR] SPPB score of 9 [7–11] points and median adjusted MMSE score of 27 [26.3–28.4] points). According to the FI, 63 participants (34.2%) were classified as nonfrail, 79 (42.9%) as prefrail, and 42 (22.8%) as frail. Considering BP below 140/90 mm Hg as target, it was well‑controlled in 75 participants (40%). The main characteristics of the study participants are summarized in Table 1, and additional information on antihypertensive and insomnia treatment is reported in Supplementary material, Tables S2 and S3. In this descriptive section, P values for between‑group comparisons could not determine a real difference due to the sample size.33
Parameter | Nonfrail; FI <0.15 (n = 63) | Prefrail; FI, 0.15–0.25 (n = 79) | Frail; FI ≥0.25 (n = 42) | P value | |
Data are presented as number (percentage), mean (SD), or median (interquartile range).
a ANOVA model; b χ2 test; c Fisher test; d Kruskal–Wallis test
Abbreviations: ACS, acute coronary syndrome; ANOVA, analysis of variation; BiPAP, bilevel positive airway pressure; BMI, body mass index; CCB, calcium channel blocker; CCI, Charlson Comorbidity Index; COPD, chronic obstructive pulmonary disease; CPAP, continuous positive airway pressure; DBP, diastolic blood pressure; FI, frailty index; MMSE, Mini‑Mental State Examination; OSA, obstructive sleep apnea; SBP, systolic blood pressure; SPPB, Short Physical Performance Battery | |||||
Age, y | 80.43 (3.73) | 81.91 (4.33) | 83.48 (5.43) | 0.003a | |
Sex | Women | 40 (63) | 58 (73) | 28 (67) | 0.43b |
Men | 23 (37) | 21 (27) | 14 (33) | ||
BMI, kg/m2 | 25.35 (3.54) | 25.72 (4.25) | 25.63 (4.93) | 0.89a | |
Office SBP, mm Hg | 148.71 (19.45) | 142.93 (21.78) | 136.18 (22.37) | 0.01a | |
Office DBP, mm Hg | 80.55 (10.5) | 78.05 (12.06) | 70.73 (9.93) | <0.001a | |
Caregiver | Self‑sufficient | 60 (95) | 60 (76) | 27 (64) | <0.001c |
Home care assistant | 0 | 5 (6) | 3 (7) | ||
Relative | 3 (5) | 14 (18) | 12 (29) | ||
Diabetes | 6 (10) | 11 (14) | 9 (21) | 0.22b | |
Dyslipidemia | 35 (56) | 49 (62) | 21 (50) | 0.42b | |
OSA | 2 (3) | 5 (6) | 4 (10) | 0.41c | |
Treatment with CPAP/BiPAP | 1 (2) | 4 (5) | 2 (5) | 0.61c | |
COPD | 2 (3) | 6 (8) | 6 (14) | 0.11c | |
Previous ACS | 0 | 6 (8) | 5 (12) | 0.01c | |
Heart valve disease | 2 (3) | 3 (4) | 2 (5) | >0.99c | |
Heart failure | 1 (2) | 3 (4) | 8 (19) | 0.002c | |
Chronic kidney disease | 4 (6) | 6 (8) | 4 (10) | 0.88c | |
Atrial fibrillation | 3 (5) | 17 (22) | 10 (24) | 0.009b | |
Osteoarthritis | 15 (24) | 28 (35) | 24 (57) | 0.002b | |
Previous stroke | 0 | 6 (8) | 3 (7) | 0.04c | |
Malignancy | 8 (13) | 30 (38) | 13 (31) | 0.003b | |
β-Blocker or CCB | 47 (75) | 58 (73) | 30 (71) | 0.94b | |
Insomnia diagnosis | 18 (29) | 36 (46) | 21 (50) | 0.04b | |
SPPB, points | 10 (9–11) | 9 (7–11) | 7 (4–9) | <0.001d | |
Adjusted MMSE, points | 27.31 (1.74) | 27.51 (1.79) | 26.13 (3) | 0.003a | |
Fall (previous year) | 9 (14) | 13 (16) | 12 (29) | 0.15b | |
Hospitalization (previous year) | 8 (13) | 16 (20) | 11 (26) | 0.21b | |
CCI, points | 4 (3–5) | 6 (4–7) | 6 (5–7) | <0.001d | |
Sex distribution was similar in all groups. Greater frailty was associated with an increased prevalence of insomnia, previous falls, and hospitalization in the past year.
On average, BP was within normal limits except for slightly elevated nocturnal SBP. No difference between the groups was observed for all BP measurements (Table 2). Regarding BPV, greater frailty was associated with increasing point estimates of several diastolic BPV indices, not reaching significance for 24‑hour DBP CV (P = 0.05) and for nocturnal DBP SD (P = 0.08), contrary to nocturnal DBP CV (P = 0.04).
Parameter | Nonfrail; FI <0.15 (n = 63) | Prefrail; FI, 0.15–0.25 (n = 79) | Frail; FI ≥0.25 (n = 42) | P valuea |
a ANOVA model
Abbreviations: ARV, average real variability; CV, coefficient of variation; HR, heart rate; WSD, weighted standard deviation; others, see Table 1 | ||||
Mean ambulatory BP (mm Hg) and HR (bpm) | ||||
24‑h SBP | 130.73 (13.04) | 131.44 (12.35) | 130.2 (11.93) | 0.86 |
24‑h DBP | 74.13 (7.33) | 74.13 (6.25) | 72.26 (6.81) | 0.29 |
24‑h HR | 64.59 (6.59) | 66.29 (6.69) | 65.69(5.59) | 0.29 |
Day SBP | 135.13 (13.19) | 135.84 (13.7) | 133.6 (12.81) | 0.67 |
Day DBP | 78.42 (8.17) | 78.7 (7.64) | 76.7 (7.99) | 0.39 |
Day HR | 68.14 (7.59) | 69.08 (7.53) | 68.15 (5.88) | 0.68 |
Night SBP | 120.29 (16.66) | 120.97 (15.27) | 122.46 (15.16) | 0.78 |
Night DBP | 65.09 (8.92) | 64.61(8.25) | 64.55 (7.42) | 0.92 |
Night HR | 58.48 (7.66) | 61.55 (7.76) | 61.8 (6.41) | 0.02 |
Short‑term BP variability | ||||
WSD 24‑h SBP | 19.9 (5.41) | 20.36 (5.59) | 20.7 (5.3) | 0.75 |
WSD 24‑h DBP | 14.69 (5.17) | 14.98 (5.25) | 16.58 (5.46) | 0.16 |
Day SD SBP | 23.26 (7.52) | 23.65 (7.28) | 23.23 (6.69) | 0.93 |
Day SD DBP | 17.56 (7.17) | 17.89 (7.19) | 19.46 (6.77) | 0.37 |
Night SD SBP | 13.19 (5.4) | 13.77 (6.16) | 15.63 (6.85) | 0.12 |
Night SD DBP | 8.94 (4.06) | 9.17 (4.25) | 10.81 (5.3) | 0.08 |
CV 24‑h SBP | 15.31 (4.29) | 15.53 (4.17) | 15.95 (4.07) | 0.74 |
CV 24‑h DBP | 19.84 (6.81) | 20.17 (6.72) | 22.98 (7.38) | 0.050 |
CV Day SBP | 17.32 (5.78) | 17.46 (5.27) | 17.41 (4.91) | 0.98 |
CV Day DBP | 22.36 (8.6) | 22.57 (8.37) | 25.22 (8.1) | 0.17 |
CV Night SBP | 10.9 (3.94) | 11.38 (4.64) | 12.78 (5.35) | 0.11 |
CV Night DBP | 13.65 (5.67) | 14.17 (6.16) | 16.83 (8.53) | 0.04 |
ARV SBP | 17.46 (5.6) | 17.06 (5.44) | 17.79 (5.6) | 0.77 |
ARV DBP | 13.11 (5.49) | 13.61 (5.68) | 14.44 (5.87) | 0.49 |
Dipping SBP | 10.83 (10.31) | 10.64 (10.09) | 8.08 (10.04) | 0.33 |
Dipping DBP | 16.64 (10.66) | 17.45 (10.94) | 15.29 (10.76) | 0.57 |
Multiple linear regression models were built to test the association between each BPV parameter and the FI (Table 3).
Parameter | SBPa | DBPb | ||
β (SE) | P value | β (SE) | P value | |
a Adjusted for age, mean 24‑h SBP, sex, mean 24‑h HR, falls in the previous year, hospitalization in the previous year, insomnia diagnosis, and use of β-blockers or CCBs
b Adjusted for age, mean 24‑h DBP, sex, mean 24‑h HR, falls in the previous year, hospitalization in the previous year, insomnia diagnosis, and use of β-blockers or CCBs
| ||||
WSD 24‑h | –0.008 (0.044) | 0.85 | 0.047 (0.042) | 0.26 |
SD Day | –0.047 (0.06) | 0.44 | 0.033 (0.057) | 0.57 |
SD Night | 0.069 (0.048) | 0.16 | 0.076 (0.037) | 0.04 |
CV 24‑h | –0.007 (0.034) | 0.83 | 0.063 (0.057) | 0.27 |
CV Day | –0.027 (0.044) | 0.53 | 0.042 (0.069) | 0.55 |
CV Night | 0.044 (0.038) | 0.25 | 0.106 (0.056) | 0.06 |
ARV | –0.024 (0.045) | 0.59 | 0.031 (0.045) | 0.49 |
Dipping | –0.17 (0.085) | 0.04 | –0.139 (0.092) | 0.13 |
No significant association was observed for SBP values except for dipping (P = 0.047). Regarding diastolic BPV, only nocturnal BPV showed a marginally significant association with frailty.
Discussion
This study investigated the underexplored relationship between BPV and frailty, and found that in older hypertensive individuals, BPV is not simply associated with frailty. We showed that 24‑hour SBP pattern was not associated with frailty, while night‑time DBP SD increased significantly with raising FI.
To our knowledge, the only prior study on a similar topic was published by Zhu et al,18 who found an association between frailty and short‑term BPV, using various metrics, such as ARV, CV, SD, and weighted SD. In that study, 24‑hour and daytime BPV values were associated with frailty in older adults, while nocturnal BPV showed a significant association only for ARV, but not for CV or SD.18
Our study differs from that of Zhu et al18 in 2 main aspects. First, our cohort consisted of very old adults (mean age >80 y), representing predominantly the old‑old population, whereas Zhu et al18 enrolled older adults at a mean age just over 70 years. Second, while Zhu et al18 included inpatients, our study focused on hypertensive outpatients.
Using traditional out‑of‑office BP monitoring methods in an inpatient setting is not fully comparable with the conventional use of this technique in ambulatory conditions. This is due to the impact of several relevant factors, including activity restriction, absence of daily stress, and varying levels of anxiety related to hospital stay. These factors may affect ABPM values in hospitalized patients, potentially altering the diagnosis of dipping patterns and the interpretation of daytime / night‑time BP values, with underestimation of day‑night BP changes.34
Similarly, we believe that BPV assessed in hospitalized patients may not reliably reflect normal variability patterns due to environmental and care‑related influences during hospitalization. Therefore, the similarity between daytime and night‑time BPV observed by Zhu et al18 might be a consequence of hospital setting.
The distinctive finding of our study appears to be the association between frailty and nocturnal diastolic BPV. We found that SD of night‑time DBP values is associated with frailty in an outpatient setting, suggesting that this parameter may represent a robust and clinically applicable measure in routine practice.
Previous research indicates that daytime and night‑time BPV may have different effects depending on patient age. The Dublin Outcome Study13 reported age‑specific variations in the significance of BPV: while diastolic BPV was significantly associated with cardiovascular events in older adults, systolic BPV was more closely associated with cardiovascular mortality in younger participants (<50 y). This age‑specific shift may reflect underlying physiological changes: with advancing age, increasing arterial stiffness primarily affects SBP, while DBP becomes more sensitive to alterations in vascular tone and autonomic function.35
Additionally, nocturnal BP patterns provide crucial insights into autonomic regulation. In physiological conditions, sympathetic withdrawal occurs at night; therefore, altered nocturnal diastolic BPV could reflect impaired autonomic modulation, particularly in frail individuals.36 Notably, night‑time BPV assessed with ABPM has been shown to significantly reclassify cardiovascular risk independently of established risk factors, including 24‑hour BP level.37
Poor sleep quality has been identified as a risk factor of frailty in a meta‑analysis of over 16 000 older adults.38 Also, the relationship between sleep and BPV remains less well defined, despite evidence suggesting potential associations between increased BPV, poor sleep quality, and longer sleep duration.39 To account for this potential confounder, we adjusted our analyses for the presence of insomnia, and the association remained significant. Pharmacologic treatment, particularly with antihypertensive agents, is also known to influence BPV. Several studies and meta‑analyses have shown that different drug classes can influence BPV, with the most relevant association demonstrated for CCBs, which have been associated with a significant reduction in BPV, while β-blockers may increase BPV. Following adjustment for these medications, the relationship between BPV and frailty remained significant.40
While both our study and that of Zhu et al18 reported the association between short‑term BPV and frailty, they did not show the direction of cause‑effect relationship. Although some evidence supports the association of long‑term (visit‑to‑visit) BPV with incident frailty,41 similar information is not available for short‑term BPV.
Strengths and limitations
This study has several strengths. It focuses on an underinvestigated topic of the association between short‑term BPV and frailty in an outpatient population of older adults with hypertension. By using 24‑hour ABPM and a validated FI based on CGA, the study provides a detailed and clinically relevant characterization of both BPV and frailty. The outpatient setting enhances the ecological validity of the BPV measurements by minimizing the confounding influences typically found in hospitalized patients, such as reduced mobility, altered circadian rhythms, and medical interventions.
However, some limitations should be acknowledged. The cross‑sectional design of the study did not allow for causal inference, and the possibility of reverse causation cannot be excluded. The study sample may be subject to selection bias, as the individuals with more severe frailty or cognitive impairment were less likely to be included, potentially underestimating the strength of the association. The sample size of our study is limited for secondary analyses, although the statistical power was adequate for the primary analysis. Although a large amount of information was collected on potential confounders, we could not collect the information on some potentially relevant clinical and laboratory variables. Additionally, the generalizability of the findings may be limited to similar outpatient populations in high‑resource settings. Lastly, while adjustments were made for several confounders, residual confounding by unmeasured factors (eg, physical activity level, medication adherence, etc.) cannot be ruled out.
Conclusions
Predicting negative health outcomes related to frailty is crucial in the management of older patients. BPV was shown to predict hypertension‑mediated organ damage, cardiovascular events, and mortality in different populations.42 Our study suggests that increased BPV, especially during night‑time, may be independently associated with frailty. Notwithstanding its limitations, our work suggests a possible role of BPV in the clinical assessment of older hypertensive individuals. Further longitudinal studies are needed to confirm this association and to explore whether interventions aimed at modulating BPV can contribute to frailty prevention in aging populations.
- Kim DH, Rockwood K. Frailty in older adults. N Engl J Med. 2024; 391: 538‑548. | Crossref
- O’Caoimh R, Sezgin D, O’Donovan MR, et al. Prevalence of frailty in 62 countries across the world: a systematic review and meta‑analysis of population‑level studies. Age Ageing. 2021; 50: 96‑104. | Crossref
- Mancia G, Kreutz R, Brunström M, et al. 2023 ESH Guidelines for the management of arterial hypertension The Task Force for the management of arterial hypertension of the European Society of Hypertension: endorsed by the International Society of Hypertension (ISH) and the European Renal Association (ERA). J Hypertens. 2023; 41: 1874‑2071. | Crossref
- Cegłowska U, Burzyńska M, Prejbisz A, et al. Incidence and prevalence of registered hypertension in Poland. Pol Arch Intern Med. 2024; 134: 16746. | Crossref
- Vetrano DL, Palmer KM, Galluzzo L, et al. Hypertension and frailty: a systematic review and meta‑analysis. BMJ Open. 2018; 8: 24406. | Crossref
SUPPLEMENTARY MATERIAL
ARTICLE INFORMATION