
Diagnostic utility of noninvasive tests for significant liver fibrosis in patients with metabolic dysfunction–associated steatotic liver disease
Key words: Fibrosis-4, Hepamet score, metabolic dysfunction–associated steatotic liver disease, noninvasive tests, significant fibrosis

 CC BY 4.0
Diagnostic utility of noninvasive tests for significant liver fibrosis in patients with metabolic dysfunction–associated steatotic liver disease
CC BY 4.0
Introduction: Global rise in obesity and metabolic syndrome has increased incidence of metabolic dysfunction–associated steatotic liver disease (MASLD). Owing to its high prevalence and the emergence of new therapies, noninvasive tests (NITs) for liver fibrosis are becoming more widely used.
Objectives: The aim of this study was to analyze and compare NIT performance in identifying fibrosis of grade F2 or greater in patients with MASLD confirmed on liver biopsy.
Patients and methods: This study was a retrospective analysis of 134 patients. The accuracy of 9 NITs in identifying significant fibrosis was assessed, and new thresholds were proposed using the Youden index.
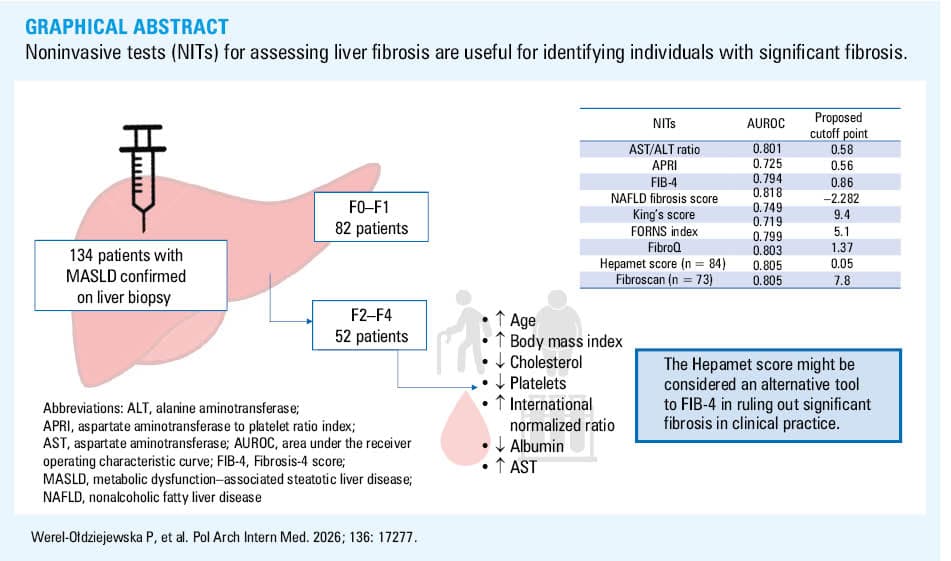
Results: The group with fibrosis grade F2 or greater (n = 52) was older (P = 0.002), had higher body mass index (P <0.001), lower platelet count (P <0.001), total cholesterol (P = 0.005) and albumin levels (P = 0.02), and higher aspartate aminotransferase activity (P = 0.003) and international normalized ratio (P = 0.02) than the group without significant fibrosis (n = 82). Areas under the receiver operating characteristic curve above 0.8 were obtained for the nonalcoholic fatty liver disease fibrosis score (0.818), Fibroscan (0.805), Hepamet score (0.803), and aspartate aminotransferase / alanine aminotransferase ratio (0.802). The highest sensitivity and negative predictive value were obtained for the Fibrosis‑4 and Hepamet score. The new optimal thresholds were lower than those previously presented in the literature, which was associated with an increase in the NIT sensitivity and negative predictive value.
Conclusions: NITs for assessing liver fibrosis are useful for identifying patients with significant fibrosis, but lower thresholds should be considered. The Hepamet score might be considered an alternative tool to the Fibrosis‑4 score in ruling out significant fibrosis in clinical practice.
Introduction
Metabolic dysfunction–associated steatotic liver disease (MASLD) is currently the most common cause of noninfectious hepatitis worldwide, with prevalence reaching 38%.1 It is strongly associated with metabolic risk factors, including obesity, type 2 diabetes (T2D), dyslipidemia, and hypertension, and its incidence has been rising constantly over the years in proportion to the global increase in obesity and metabolic syndrome (MetS).2 In the United States, cirrhosis due to MASLD is the second most common indication for liver transplant.3 MASLD is considered a liver manifestation of MetS, and the main factor in its pathogenesis is insulin resistance at the level of adipose tissue and the liver.4-6 In accordance with the newest guidelines, MASLD is defined as the presence of hepatic steatosis (diagnosed on imaging or liver biopsy) with the presence of at least 1 criterion of cardiometabolic risk factors, with the exclusion of other potential causes of steatosis and excessive alcohol consumption.7 The major concern is progression to advanced liver disease, and individuals with metabolic dysfunction–associated steatohepatitis (MASH) and fibrosis stages F2–F4 on liver biopsy, called “at risk MASH”, have a particularly increased risk of liver‑related morbidity and mortality.8 The incidence of decompensated cirrhosis, hepatocellular carcinoma, and death associated with MASLD is estimated to increase 2–3‑fold by 2030.9 These data underscore the importance of early diagnosis and intervention. Steatotic liver disease can also affect the outcome of other liver diseases, such as hepatitis B or autoimmune hepatitis.10,11
Although liver biopsy, which assesses inflammation and ballooning stage, remains the gold standard in MASH diagnosis, owing to the high prevalence of MASLD and the emergence of new therapies for patients with as early as stage 2 (significant) fibrosis, noninvasive tests (NITs) for liver fibrosis are increasingly being used in clinical practice. The guidelines include simple tests based on clinical data and routine blood parameters (aspartate aminotransferase / alanine aminotransferase [AST/ALT] ratio, Fibrosis‑4 [FIB‑4], AST to platelet ratio index [APRI], nonalcoholic fatty liver disease [NAFLD] fibrosis score) or less available in practical use but more complex proprietary models (Enhanced Liver Fibrosis, ADAPT), as well as imaging‑based tests (transient elastography‑liver stiffness measurement, shear‑wave elastography or magnetic resonance imaging‑magnetic resonance elastography).12,13 In the literature, other NITs for assessing liver fibrosis in other liver diseases, such as the King’s score, the FORNS index, the Hepamet score, and the FibroQ have also been described.14-19 However, the results regarding their clinical utility and accuracy vary among published reports, and most of them concern identifying patients with advanced fibrosis, defined as F3–F4. Therefore, the aim of our study was to retrospectively analyze the clinical and biochemical parameters and imaging findings of patients with MASLD confirmed on liver biopsy and compare the accuracy of noninvasive diagnostic methods for identifying significant (≥F2) liver fibrosis.
Patients and methods
Study group
The study was based on a retrospective analysis of medical history of patients with MASLD confirmed on liver biopsy who were hospitalized at the Department of Internal Medicine and Hepatology of the National Medical Institute of the Ministry of the Interior and Administration in Warsaw from January 1, 2018 to December 31, 2024. All the patients were hospitalized in order to diagnose chronic hepatitis, and liver biopsy was performed due to persistent elevation of AST or ALT activity. Before the procedure, written informed consent was obtained. The exclusion criteria comprised the presence of other potential causes of hepatic steatosis (such as medications taken or suspicion of familial hypercholesterolemia), suspected excessive alcohol consumption (>20 g/d or 140–350 g/week for women and >30 g/d or 210–420 g/week for men), or the coexistence of other liver diseases (suspicion of concomitant autoimmune liver disease, cholestatic liver disease, hemochromatosis, or history of hepatitis C). Ethical approval for the study was obtained from the bioethics committee of the Medical University in Bialystok, Poland (APK.002.375.2023).
Anthropometric, laboratory, and imaging tests
For all patients, data regarding age, weight, height, waist circumference, and blood pressure were retrieved from medical history. Additionally, complete blood count, liver enzyme activity (ALT, AST), cholestatic enzyme activity (alkaline phosphatase, γ-glutamyltransferase), liver function parameters (international normalized ratio [INR], albumin, bilirubin), creatinine, fasting glucose, fasting insulin, glycated hemoglobin (HbA1c), and lipid profile (total cholesterol [TC], low‑density lipoprotein cholesterol [LDL‑C], high‑density lipoprotein cholesterol [HDL‑C], non‑HDL cholesterol [non–HDL‑C], triglycerides [TGs]) were recorded. The presence of MetS was based on the 2009 International Diabetes Federation, National Heart, Lung, and Blood Institute, American Heart Association, World Heart Federation, International Atherosclerosis Society, and International Association for the Study of Obesity consensus,20 and owing to limited data on waist circumference (n = 35), it was assumed that participants with body mass index (BMI) equal to or greater than 30 kg/m2 had abdominal obesity. Dyslipidemia was defined as LDL‑C level above 115 mg/dl or TG level above 150 mg/dl or HDL‑C level for women below 50 mg/dl, and for men below 40 mg/dl or treatment for dyslipidemia. T2D was identified based on medical history taken on admission or diagnosed during the hospitalization (based on 2 results of fasting glucose level, oral glucose tolerance test or HbA1c level according to Diabetes Poland, European Association for the Study of Diabetes, and American Diabetes Association guidelines). The homeostatic model assessment for insulin resistance, quantitative insulin sensitivity check index, and triglyceride‑glucose index were calculated to assess insulin sensitivity.
The NITs for liver fibrosis, namely, the AST/ALT ratio, FIB‑4 score, APRI, NAFLD fibrosis score, King’s score, FORNS index, Hepamet score, and FibroQ were calculated on the basis of the published formulas. Additionally, in 73 participants, liver stiffness was measured using vibration‑controlled transient elastography via Fibroscan (Table 1).
Test | Formula | Threshold values |
Abbreviations: ALT, alanine aminotransferase; APRI, aspartate aminotransferase to platelet ratio index; AST, aspartate aminotransferase; BMI, body mass index; FIB‑4, Fibrosis‑4 score; GGT, γ-glutamyltransferase; HOMA‑IR, homeostasis model assessment of insulin resistance; INT, international normalized ratio; NAFLD, nonalcoholic fatty liver disease; ULN, upper limit of normal | ||
AST/ALT ratio7 | AST/ALT |
|
FIB‑47,42 | (age × AST)/(platelets × √ALT) |
|
APRI7,43 | (AST/ASTULN)/platelets × 100 |
|
NAFLD fibrosis score7,44 | –1.675+0.037 × age +0.094 × BMI + 1.13 × impaired fasting glucose or diabetes (yes = 1, no = 0) + 0.99 × AST/ALT ratio−0.013 × platelet count−0.66 × albumin |
|
Hepamet score14 | 1/(1 + exp [5.39−0.986 × age {45–64 y} − 1.719 × age {≥65 y} + 0.875 × male sex−0.896 × AST {35–69 IU/l}−2.126 × AST {≥70 IU/l}−0.027 × albumin {4–4.49 g/dl} − 0.897 × albumin {<4 g/dl}−0.899 × HOMA‑IR {2−3.99 with no diabetes mellitus} − 1.497 × HOMA‑IR {≥4 with no diabetes mellitus}−2.184 × diabetes mellitus−0.882 × platelets × 1/µl {155–219}−2.233 × platelets × 1/µl {<155}]) |
|
King’s score15 | (Age × AST × INR)/platelets |
|
FORNS index18 | 7.811 − 3.131 × ln (platelets) + 0.781 × ln(GGT) + 3.467 × ln(age) − 0.014 × (cholesterol) |
|
FibroQ19 | (10 × age × AST × INR)/(platelets × ALT) |
|
Fibroscan7,31 | Liver stiffness measurement on vibration controlled transient elastography |
|
Liver biopsy samples were assessed by the NASH Clinical Research Network. Two groups of patients were distinguished according to the degree of fibrosis on the liver biopsy: those with minor fibrosis (F0–F1) and those with significant fibrosis (≥F2).
Statistical analyses
Statistical analyses were performed using Statistica 13.0 (StatSoft) and Stata 18.5 (StataCorp) software. The normality of distribution of the studied parameters was evaluated using the Shapiro–Wilk test. Due to a lack of normal distribution of the data, nonparametric tests were used in the analysis.
Comparisons between the participants with MASLD with minor fibrosis (<F2) and those with significant fibrosis (≥F2) were made using the Mann–Whitney test. As the groups with and without significant fibrosis differed in terms of age, BMI, and sex distribution, multivariable linear regression models were used to compare clinical and laboratory parameters, using the tested parameter as a dependent variable and the presence of significant fibrosis, sex, age, and BMI as independent variables. Due to a lack of normal distribution of the residuals, the concentrations of creatinine, HDL‑C, TGs, TG/HDL‑C ratio, and platelet count were log‑transformed prior to linear regression analysis. Robust SEs were calculated to account for heteroscedasticity.
Univariable logistic regression models were used to assess the association between the presence of significant fibrosis (dependent variable) and the results of each NIT separately (continuous independent variable). The areas under the receiver operating characteristic (ROC) curves (AUROCs) for the studied indices were calculated and compared using the test by DeLong et al.21 The probability cutoff to calculate sensitivity, specificity, and positive and negative predictive values (NPVs) was set individually for each model. Additionally, multivariable regression models were used to verify whether combining one of the NITs with Fibroscan would improve the ability to identify individuals with significant fibrosis (dependent variable—the presence of significant fibrosis, independent variables—Fibroscan plus any of the following: NAFLD fibrosis score, Hepamet score, AST/ALT ratio, FIB‑4). In the next step, the Youden index was used to compute threshold values for each NIT that would best predict significant fibrosis in the study group.
The level of significance was set at a P value below 0.05.
Results
The analysis initially included 202 patients with MASLD confirmed on liver biopsy. Due to missing data (n = 40), the presence of other potential causes of hepatic steatosis (n = 4), suspected excessive alcohol consumption (n = 6), or the coexistence of other liver diseases (n = 18), 68 patients were excluded from the study. Finally, the study included 134 patients (43 women, 91 men) with MASLD with the characteristics presented in Table 2.
Characteristic | Value | ||
Abbreviations: MASH, metabolic dysfunction–associated steatohepatitis; MASL, metabolic dysfunction–associated liver steatosis; MASLD, metabolic dysfunction–associated steatotic liver disease; T2D, type 2 diabetes; others, see Table 1 | |||
Sex | Men | 43 (32.1) | |
Women | 91 (67.9) | ||
BMI, kg/m2 | Normal weight (18.5–24.99) | 6 (4.48) | |
Overweight (25–29.99) | 67 (50) | ||
Obesity (≥30) | 61 (45.52) | ||
Comorbidities | Hypertension | Yes | 60 (44.78) |
No | 74 (55.22) | ||
Dyslipidemia | Yes | 116 (86.57) | |
No | 18 (13.43) | ||
T2D | Yes | 31 (23.13) | |
No | 103 (76.87) | ||
Metabolic syndrome (n = 129) | Yes | 85 (63.43) | |
No | 49 (36.57) | ||
MASLD | MASL | 42 (31.34) | |
MASH | 92 (68.66) | ||
Fibrosis stage | F0 | 6 (4.48) | |
F1 | 76 (56.72) | ||
F2 | 30 (22.34) | ||
F3 | 14 (10.45) | ||
F4 | 8 (5.97) | ||
According to the liver biopsy results, 52 participants (26 women, 26 men) had significant fibrosis (≥F2), whereas minor fibrosis (<F2) was found in 82 participants (17 women, 65 men). The group of patients with significant fibrosis was older (P = 0.002) and had higher BMI (P <0.001). After adjusting for sex, age, and BMI in linear regression, lower levels of TC (P = 0.005), LDL‑C (P = 0.04), non–HDL‑C (P = 0.02), TGs (P = 0.03), platelets (P <0.001), creatinine (P = 0.002) and estimated glomerular filtration rate (eGFR; P <0.001) were observed in the participants with significant fibrosis (Table 3). The liver test results showed that the group with significant fibrosis had not only greater AST activity (P = 0.003) but also a higher INR (P = 0.02) and lower albumin level (P = 0.02) than the group with minor fibrosis (Table 4).
Parameter | Total (n = 134) | Minor fibrosis, <F2 (n = 82) | Significant fibrosis, ≥F2 (n = 52) | P value | P’ value |
Values are expressed as median (interquartile range). P values were calculated with the Mann–Whitney test, and comparisons were made between the groups with minor and significant fibrosis; P’ values were calculated using multivariable linear regression models with the examined parameter as a dependent variable, and the presence of significant fibrosis, sex, age, and BMI as independent variables (for eGFR, sex, and age were omitted).
a Variables were log‑transformed prior to regression analysis.
SI conversion factors: to convert total cholesterol, LDL‑C, and HDL‑C to mmol/l, multiply by 0.0259; TG to mmol/l, by 0.0114; insulin to pmol/l, by 6; and glucose to mmol/l, by 0.0555.
Abbreviations: eGFR, estimated glomerular filtration rate; HbA1c, glycated hemoglobin; HDL‑C, high‑density lipoprotein cholesterol; LDL‑C, low‑density lipoprotein cholesterol; TG, triglyceride; TyG index, triglyceride glucose index; QUICKI, quantitative insulin sensitivity check index; WBC, white blood cell count; others, see Tables 1 and 2 | |||||
Age, y | 38 (30–50) | 35 (28–45) | 48 (33–57) | 0.001 | – |
Weight, kg | 93 (81–103) | 90.5 (81–101) | 96.5 (82.5–105.5) | 0.18 | – |
Height, m | 1.76 (1.68–1.83) | 1.78 (1.71–1.83) | 1.72 (1.64–1.81) | 0.02 | – |
BMI, kg/m2 | 29.43 (27.13–33.02) | 28.23 (26.22–31.11) | 32.02 (28.27–34.48) | <0.001 | – |
Total cholesterol, mg/dl (n = 133) | 181 (151–205) | 187 (165–209) | 168 (139–200) | 0.03 | 0.005 |
LDL‑C, mg/dl (n = 131) | 103 (79–131) | 111 (90–134) | 93.5 (74–123) | 0.04 | 0.04 |
HDL‑C, mg/dl (n = 131)a | 43 (36–53) | 42 (36–52) | 43 (35–54) | 0.97 | 0.37 |
non–HDL‑C, mg/dl (n = 131) | 137 (105–158) | 141 (115–162) | 115 (99–152) | 0.01 | 0.02 |
TGs, mg/dl (n = 132)a | 138 (108–191.5) | 141 (115–203) | 123 (98–166) | 0.03 | 0.03 |
WBC, × 103/µl | 6.86 (6.03–8.54) | 6.8 (6.07–8.21) | 6.84 (5.94–8.98) | 0.6 | >0.99 |
Hb, g/dl | 15.1 (14–15.9) | 15.3 (14.4–16) | 14.7 (13.75–15.6) | 0.04 | 0.54 |
Platelets, × 103/µla | 239.5 (204–285) | 259.5 (217–295) | 222.5 (192–262) | 0.001 | 0.001 |
Creatinine, mg/dla | 0.89 (0.79–0.98) | 0.88 (0.78–0.97) | 0.89 (0.79–0.98) | 0.81 | 0.003 |
eGFR, ml/min/1.73 m2 | 97.5 (83–110) | 101.5 (88–113) | 86 (72–104.5) | 0.001 | <0.001 |
Fasting glucose, mg/dl (n = 112) | 86 (79.5–93.5) | 86 (79–91) | 87 (82.5–104) | 0.21 | 0.77 |
T2D (+) (n = 20) | 109.5 (88.0–133.5) | 122 (106–137) | 109 (87–130) | 0.30 | 0.005 |
T2D (–) (n = 92) | 85 (78–90) | 85 (78–90) | 83.5 (77.5–89) | 0.84 | 0.76 |
Insulin, µIU/ml (n = 63) | 13.2 (9.7–19.9) | 12 (8.8–17.7) | 16.7 (10–24.5) | 0.23 | 0.91 |
HbA1c, % (n = 59) | 5.4 (5.1–5.8) | 6.1 (5.5–6.9) | 5.6 (5.2–6.4) | 0.01 | 0.4 |
HOMA‑IR (n = 62) | 2.83 (1.96–4.32) | 2.67 (1.84–3.98) | 3.89 (2.28–5.08) | 0.07 | 0.58 |
QUICKI (n = 62) | 0.33 (0.31–0.34) | 0.33 (0.31–0.35) | 0.31 (0.3–0.34) | 0.07 | 0.6 |
TyG index (n = 109) | 8.76 (8.44–9.02) | 8.76 (8.44–9.12) | 8.72 (8.38–8.94) | 0.43 | 0.21 |
TG/HDL‑C ratio (n = 130)a | 3.37 (1.97–5) | 3.48 (2.18–5.36) | 2.92 (1.87–4.22) | 0.16 | 0.31 |
Parameter | Total (n = 134) | Minor fibrosis, <F2 (n = 82) | Significant fibrosis, ≥F2 (n = 52) | P value |
Values are expressed as median (interquartile range). P values were calculated with the Mann–Whitney test, comparisons were made between the groups with minor and significant fibrosis.
SI conversion factors: to convert bilirubin to μmol/l, multiply by 17.104.
Abbreviations: ALP, alkaline phosphatase; others, see Table 1 | ||||
AST, U/l | 49.5 (37–71) | 44 (35–60) | 57.5 (41.5–94.5) | 0.003 |
ALT, U/l | 94.5 (73–128) | 94.5 (75–132) | 94.5 (66–125.5) | 0.43 |
GGT, U/l | 63 (39–133) | 62 (41–133) | 68.5 (37.5–131.5) | >0.99 |
ALP, U/l | 84 (68–106) | 83.5 (67–106) | 84.5 (68.5–101) | 0.89 |
Bilirubin, mg/dl | 0.58 (0.44–0.8) | 0.61 (0.44–0.8) | 0.57 (0.43–0.79) | 0.66 |
INR | 1.05 (1–1.12) | 1.04 (0.99–1.1) | 1.08 (1.01–1.15) | 0.02 |
Albumin, g/dl | 4.74 (4.55–4.97) | 4.82 (4.62–5.06) | 4.7 (4.44–4.87) | 0.02 |
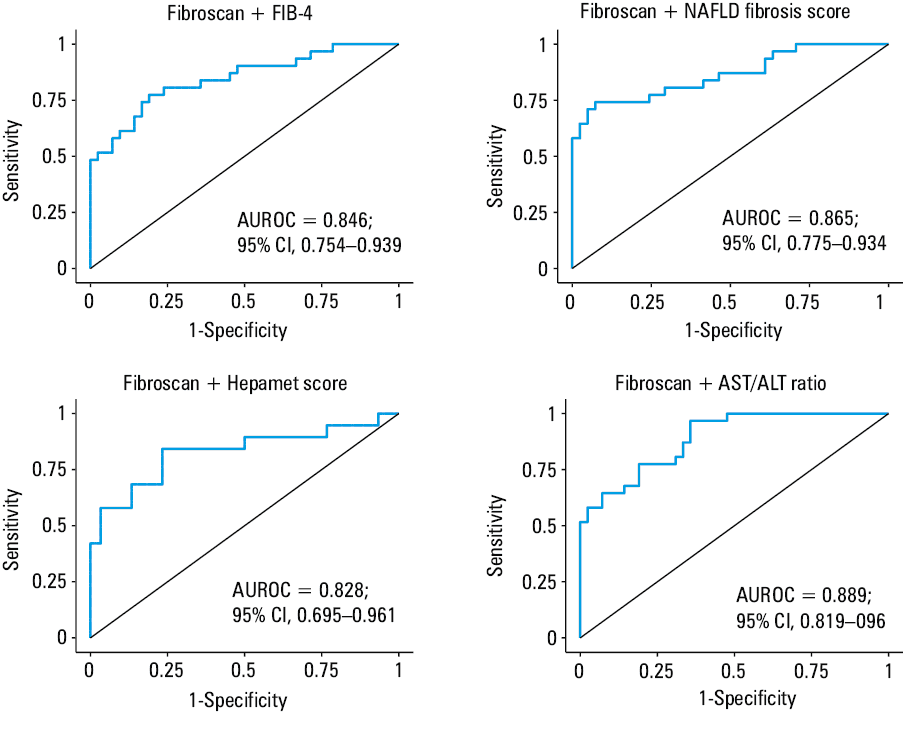
Univariable logistic regression was used to assess the utility of NITs in identifying the patients with significant fibrosis (dependent variable: the presence of significant fibrosis; continuous independent variable: NIT result; Table 5). AUROCs above 0.8 were obtained for the NAFLD fibrosis score (0.818), Fibroscan (0.805), Hepamet score (0.803) and AST/ALT ratio (0.802). The AUROCs of the other tests (FIB‑4, APRI, King’s score, FORNS index, and FibroQ) were above 0.7. Nevertheless, the differences in the AUROC of NITs were not significant. The FIB‑4 and Hepamet score presented the highest sensitivity and NPVs, and Fibroscan had the highest specificity and positive predictive value (PPV; Table 5). When Fibroscan was combined with any of the laboratory‑based NITs with the highest individual AUROCs (NAFLD fibrosis score, Hepamet score, AST/ALT ratio, and FIB‑4), higher AUROCs were obtained, but the differences were not significant (Figure 1).
Test | AUROC | Probability cutoff | Sensitivity, % | Specificity, % | Positive predictive value, % | Negative predictive value, % | Positive likelihood ratio | Negative likelihood ratio | Diagnostic odds ratio | Diagnostic accuracy |
All values were derived from univariable logistic regression models with significant fibrosis as a dependent variable and the results of each noninvasive test as a continuous independent variable.
Abbreviations: AUROC, area under ROC curve; ROC, receiver operating characteristic; others, see Table 1 | ||||||||||
AST/ALT ratio | 0.802 | 0.34 | 73.08 | 73.17 | 63.33 | 81.08 | 2.2 | 0.37 | 7.4 | 73.13 |
APRI | 0.725 | 0.34 | 67.31 | 64.63 | 54.69 | 75.71 | 1.9 | 0.51 | 3.76 | 65.67 |
FIB‑4 | 0.794 | 0.34 | 76.92 | 75.61 | 66.67 | 83.78 | 3.15 | 0.31 | 10.33 | 76.12 |
NAFLD fibrosis score | 0.818 | 0.36 | 69.23 | 68.75 | 59.02 | 77.46 | 2.22 | 0.45 | 4.95 | 68.94 |
King’s score | 0.749 | 0.34 | 71.15 | 74.39 | 63.79 | 80.26 | 2.78 | 0.39 | 7.17 | 73.13 |
FORNS index | 0.719 | 0.39 | 60.78 | 67.07 | 53.45 | 73.33 | 1.85 | 0.58 | 3.16 | 64.66 |
FibroQ | 0.799 | 0.32 | 69.23 | 73.17 | 62.07 | 78.95 | 2.58 | 0.42 | 6.14 | 71.64 |
Hepamet score (n = 84) | 0.803 | 0.3 | 75.76 | 72.55 | 64.1 | 82.22 | 2.76 | 0.33 | 8.26 | 73.81 |
Fibroscan (n = 73) | 0.805 | 0.32 | 74.19 | 76.19 | 69.7 | 80 | 3.12 | 0.34 | 9.2 | 75.34 |
For most NITs (except for the APRI, FORNS, and FibroQ), the proposed thresholds to identify significant fibrosis were lower than those previously reported in the literature (Table 1), which was associated with an increase in the sensitivity and NPV that improved their ability to exclude patients with significant fibrosis (Table 6).
Test | Threshold value | Sensitivity, % | Specificity, % | Positive predictive value, % | Negative predictive value, % | Positive likelihood ratio | Negative likelihood ratio | Diagnostic odds ratio | Diagnostic accuracy |
a The first line for each test presents sensitivity, specificity, positive and negative predictive values and likelihood ratios, diagnostic odds ratio, and diagnostic accuracy calculated for the threshold used in literature.
b The second line for each test presents the same parameters calculated for the thresholds computed with Youden index.
Abbreviations: see Table 1 | |||||||||
AST/ALT ratio | 0.8a | 34.62 | 95.12 | 81.82 | 69.64 | 7.1 | 0.69 | 10.32 | 71.64 |
0.58b | 69.23 | 80.49 | 69.23 | 80.49 | 3.55 | 0.38 | 9.28 | 76.12 | |
APRI | 0.5a | 78.85 | 48.78 | 49.4 | 78.43 | 1.54 | 0.43 | 3.55 | 60.45 |
0.56b | 76.92 | 59.76 | 54.79 | 80.33 | 1.91 | 0.39 | 4.95 | 66.42 | |
FIB‑4 | 1.3a | 59.62 | 84.15 | 70.45 | 76.67 | 3.76 | 0.48 | 7.84 | 74.63 |
0.86b | 80.77 | 74.39 | 66.67 | 85.92 | 3.15 | 0.26 | 12.2 | 76.87 | |
NAFLD fibrosis score | –1.455a | 48.08 | 97.5 | 93 | 74.29 | 19.23 | 0.53 | 36.11 | 78.03 |
–2.282b | 67.31 | 83.75 | 72.92 | 79.76 | 4.14 | 0.39 | 10.61 | 77.27 | |
King’s score | 12.3a | 57.69 | 79.27 | 63.83 | 74.71 | 2.78 | 0.53 | 5.21 | 70.9 |
9.4b | 76.92 | 70.73 | 62.5 | 82.86 | 2.63 | 0.33 | 8.06 | 73.13 | |
FORNS index (n = 133) | 4.2a | 62.75 | 63.41 | 51.61 | 73.24 | 1.72 | 0.59 | 2.92 | 63.16 |
5.1b | 54.9 | 84.15 | 68.29 | 75 | 3.46 | 0.54 | 6.46 | 72.93 | |
FibroQ | 0.6a | 90.38 | 36.59 | 47.47 | 85.71 | 1.43 | 0.26 | 5.42 | 57.46 |
1.37b | 57.69 | 90.24 | 78.95 | 77.08 | 5.91 | 0.47 | 12.61 | 77.61 | |
Hepamet score (n = 84) | 0.12a | 66.67 | 78.43 | 66.67 | 78.43 | 3.09 | 0.43 | 7.27 | 73.81 |
0.05b | 84.85 | 72.55 | 66.67 | 88.1 | 3.09 | 0.21 | 14.8 | 77.38 | |
Fibroscan (n = 73) | 8a | 61.29 | 90.48 | 82.61 | 76 | 6.44 | 0.43 | 15.04 | 78.08 |
7.8b | 64.52 | 88.1 | 80 | 77.08 | 5.42 | 0.4 | 13.45 | 78.08 | |
Discussion
Our study compared 9 NITs for diagnosing significant fibrosis in 134 patients with MASLD confirmed on liver biopsy. Notably, we also included patients with at least F2 stage disease on the liver biopsy (≥F2). Furthermore, the Hepamet score has been shown to be a useful alternative to FIB‑4 as a screening test for the identification of patients with significant fibrosis. In our study, the proposed thresholds for NITs estimated by the Youden index were lower than those previously reported in the literature (Table 1; except for the APRI score, FORNS index, and FibroQ), which was associated with increases in their sensitivity and NPV.
According to group characteristics, the group with significant fibrosis (≥F2) was older and had higher BMI, which corresponds to the fact that obesity is an independent risk factor for the progression of liver fibrosis and the development of cirrhosis.22 Regarding laboratory findings, lower levels of TC, LDL‑C, non–HDL‑C, and TGs were observed in the participants with significant fibrosis, which likely reflected impaired hepatic synthetic function and altered lipid metabolism, as described in cohort studies.23 Lower creatinine level and lower eGFR were also observed in the group with significant fibrosis, which is supported by a meta‑analysis showing a strong association between higher fibrosis stage and increased risk of chronic kidney disease in MASLD.24 The FIB‑4 incorporates age, AST and ALT activity, and platelet count, reflecting the fact that lower platelet count and higher AST activity are characteristic laboratory findings in advanced fibrosis, which has also been proved in our group with significant fibrosis. The observed greater INR and lower albumin level are also well‑established markers of hepatic synthetic dysfunction and progressive liver injury.
Considering the high prevalence of MASLD worldwide, the first step in clinical practice should focus on ruling out significant fibrosis. The effectiveness of excluding it is demonstrated by high sensitivity and NPV of the test. The guidelines recommend the initial use of FIB‑4 due to its greatest validity, simplicity, and availability.7,25 It is widely used in fibrosis assessment in large cohorts and also in outcome prediction of other liver diseases.26-28 Moreover, FIB‑4 is suggested as a useful marker of multisystem morbidity, early mortality, and health care burden that extend beyond hepatology and fibrosis assessment.29 In our study, FIB‑4 also presented the highest sensitivity and NPV. In the literature, some reports suggest the superiority of Hepamet score in identifying patients with advanced fibrosis.14 We found that the Hepamet score also showed a slightly higher AUROC than the FIB‑4 in the diagnosis of significant fibrosis. Notably, the Hepamet score includes not only basic tests assessing liver condition (such as AST activity and albumin and platelet levels) but also insulin resistance and T2D, which are the main factors in the pathogenesis of MASLD. Although assessing these additional parameters would be difficult in daily practice, using them would prompt practitioners to monitor patients for the development of important comorbidities, such as insulin resistance or T2D, which affect the overall outcome. Comparing other NITs (King’s score, FORNS index, or FibroQ), we found that none of them were superior for identifying patients with significant fibrosis, and their AUROCs remained between 0.7 and 0.8.
In line with previous reports,30-33 in our study, the combination of laboratory tests, such as the FIB‑4 score, NAFLD fibrosis score, or Hepamet score with liver stiffness measurement (Fibroscan) yielded better diagnostic accuracy, as reflected by higher AUROC, but the difference was not significant. On the other hand, Fibroscan appears to be a good choice for confirming significant fibrosis due to its high specificity and PPV.
In the existing reports considering patients with significant (≥F2) fibrosis, it seems that the ability of individual tests to identify these patients is lower than their effectiveness in diagnosing advanced (≥F3) fibrosis.34,35 In our study, the new thresholds were lower than those previously reported in the literature (except for the APRI score, FORNS index, and FibroQ), which was associated with an increase in their sensitivity and NPV, highlighting their potential utility as noninvasive tools for ruling out significant fibrosis. The guidelines of the European associations (European Association for the Study of the Liver [EASL], European Association for the Study of Diabetes [EASD], European Association for the Study of Obesity [EASO]) also suggest the use of a lower threshold (0.66–0.89) for FIB‑4 to exclude significant (≥F2) fibrosis, which is similar to the results of our study.7 According to the literature, some studies have shown that the diagnostic accuracy of NITs decreases in patients aged below 35 years and those aged 65 years or older, as well as in patients with normal body weight, class III obesity, T2D, or normal aminotransferase levels.36-39 McPherson et al7 suggested the use of a threshold of 2 for FIB‑4 in patients aged 65 years and older to rule out significant fibrosis, which is also emphasized in the latest recommendations of the European societies (EASL, EASD, EASO).7 Furthermore, after analyzing 1050 patients, Ishiba et al40 estimated lower (excluding advanced fibrosis) and upper (confirming advanced fibrosis) thresholds for individual age categories: 1.05 and 1.21 for individuals up to 49 years of age, 1.24 and 1.96 for patients between 50 and 59 years old, 1.88 and 3.24 for patients between 60 and 69 years old, and 1.95 and 4.56 for those over 70 years old.40 Green et al41 demonstrated better diagnostic accuracy in the obese population when lower thresholds for FIB‑4 (0.88 and 1.24) were adopted to exclude or confirm advanced fibrosis. However, in our study, the group of patients was too small to divide them into subgroups based on age or body weight. Nevertheless, it should be noted that the median (interquartile range) age of our group was 38 (30–50) years, whereas in the group with minor fibrosis (<F2), it was 35 (28–45) years, which may also influence the benefit of using the lower thresholds in the study group.
Limitations
Several limitations of the present study should be mentioned, such as missing data on anthropometric, biochemical, and imaging parameters in some patients (waist circumference, fasting glucose and insulin concentration, HbA1c level, and liver stiffness measurements), a lack of histopathological verification by a second pathologist, and the relatively small group of patients with advanced F3–F4 fibrosis. However, the strength of this study is the large group of patients with MASLD confirmed on liver biopsy, which remains the gold standard in the diagnosis of MASLD. This allowed for a detailed analysis of these patients in terms of clinical data and biochemical test results, as well as a comparison of NITs for significant liver fibrosis with reference to biopsy.
Conclusions
The role of NITs seems to be particularly important in the treatment for patients with MASH with significant fibrosis (≥F2), and they seem useful in identifying patients with significant fibrosis. The Hepamet score might be considered an alternative tool to FIB‑4 in ruling out significant fibrosis in clinical practice. When NITs are used to diagnose F2–F4 liver fibrosis, lower thresholds should be considered, but further research in larger groups of patients is needed.
- Wong VWS, Ekstedt M, Wong GLH, Hagström H. Changing epidemiology, global trends and implications for outcomes of NAFLD. J Hepatol. 2023; 79: 842‑852.
- Ali SMJ, Lai M. Metabolic dysfunction‑associated steatotic liver disease. Ann Intern Med. 2025; 178: ITC1‑ITC16.
- Younossi ZM, Stepanova M, Ong J, et al. Nonalcoholic steatohepatitis is the most rapidly increasing indication for liver transplantation in the United States. Clin Gastroenterol Hepatol. 2021; 19: 580‑589.e5.
- Li Y, Yang P, Ye J, et al. Updated mechanisms of MASLD pathogenesis. Lipids Health Dis. 2024; 23: 117.
- Hardy T, Oakley F, Anstee QM, Day CP. Nonalcoholic fatty liver disease: pathogenesis and disease spectrum. Annu Rev Pathol. 2016; 11: 451‑496.
ARTICLE INFORMATION