
Patient perspective on the management of hypertension in 7 European countries: insights from a survey of 4001 patients
Key words: adherence, home blood pressure, information, medications, risk factors

 CC BY 4.0
Patient perspective on the management of hypertension in 7 European countries: insights from a survey of 4001 patients
CC BY 4.0
Introduction: Few studies have assessed patient perception of the management of their hypertension in Europe.
Objectives: We aimed to compare the attitudes, barriers, and expectations of patients receiving treatment for hypertension in 7 European countries.
Patients and methods: Cross‑sectional data were obtained between January and April 2023, using a web‑based questionnaire translated into each country’s official language and distributed in the Czech Republic, France, Germany, Italy, Poland, Spain, and the United Kingdom (UK). A total of 4001 treated hypertensive adults returned a valid questionnaire. Their mean (SD) age was 68.3 (9.2) years (median, 70 y), 59.7% were men, and 91% were treated for longer than 1 year.
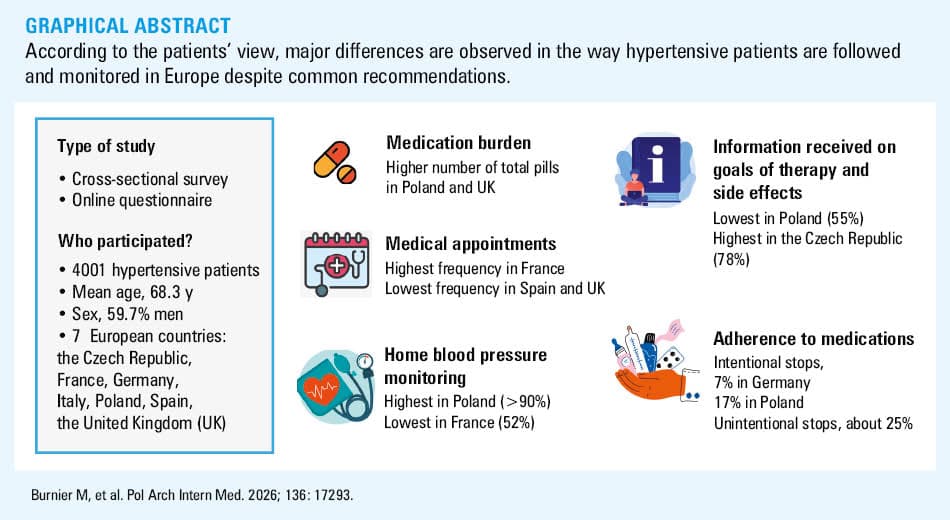
Results: The participants from Poland and the Czech Republic had a more unfavorable cardiovascular risk profile than those from other countries (P <0.001). Differences across the countries were found for lifestyle, medical, and emotional risk scores (P <0.001). A total median number of pills per day was 4 (range, 3–5/d; P <0.001 between countries) and 2 for antihypertensive drugs. The frequency of follow‑up visits per year was the highest in France and lowest in the UK (P <0.001). In all countries, 10%–20% of the participants expressed a wish for more information mainly on treatment, drug side effects, and hypertension complications. Nonintentional interruption of medications was the main cause of nonadherence.
Conclusions: According to patients, the management of hypertension is highly variable in different European countries. Our survey identified features that could be improved, such as increasing the amount of information provided to the patients, empowering the patients through adequate home blood pressure monitoring, and supporting medication adherence.
Introduction
How physicians should manage patients with elevated blood pressure (BP) or hypertension is regularly described and adapted to most recent scientific evidence by national and international societies, such as the International Society of Hypertension, the European Society of Hypertension (ESH), the European Society of Cardiology (ESC), the American College of Cardiology / American Heart Association, or Polish Society of Hypertension.1-6 These documents provide updated information on how to screen, diagnose, investigate, treat, and follow patients over time—information that is essential for cost‑effective management of hypertension in the population.7 While the implementation of the guideline recommendations has been shown to reduce cardiovascular morbidity and mortality,8,9 the quality of BP control remains a major challenge worldwide. Interestingly, recent analyses of data from 2 078 948 individuals across 133 cohorts, 39 countries, and 6 continents have shown that among the 5 major cardiovascular risk factors (hypertension, hyperlipidemia, weight problems, diabetes, and smoking), treating hypertension in midlife is the strategy that provides the most additional life‑years free of cardiovascular disease (CVD) and death from any cause.10 In Poland, recent data have shown that close to 11 million inhabitants have registered hypertension, with the highest incidence reported in men aged 55–59 years and in women aged 50–54 years.11
Few studies have assessed the attitudes, perception, and expectations of patients regarding the management of their hypertension. Some studies were small (about 20 patients) and concerned only a local situation.12 Larger surveys from Sweden (219 patients)13 and Japan (541 physicians and 881 patients)14 have shown that patients have limited understanding of their hypertension and have some concerns regarding their antihypertensive medications.13 Moreover, the perception of the scope of education they receive may differ markedly between physicians and patients.14
The aim of this study was to assess the patient views, attitudes, and perceptions on the management of their hypertension based on a questionnaire completed by 4001, mainly older, patients from 7 European countries: the Czech Republic, France, Germany, Italy, Poland, Spain, and the United Kingdom (UK).
Patients and methods
This survey was conducted by the Working Group on Lifestyle, Cardiovascular Pharmacotherapy, and Adherence of the ESH. The questionnaire and inclusion / exclusion criteria have been described previously.15 In brief, the questionnaire was submitted to treated hypertensive patients of both sexes, aged above 18 years, and living in France, Germany, Italy, Spain, the UK, the Czech Republic, and Poland. The patients had to have internet access. In 5 countries (France, Germany, Italy, Spain, and the UK), the questionnaire was distributed between January and April 2023 through a collaboration with the Senior International Health Association, a federation that brings together the associations involved at the European and international level on matters concerning elderly people with the aim of coordinating their action on health, and via the Carenity community, a social network dedicated to persons with a chronic disease, which has a large online access to patients and caregivers throughout Europe. In this case, the arterial hypertension community was invited to participate in the online survey (invitations and reminders sent by email) after translation of the questionnaire into local languages as described previously.15 In Poland, the link to the online questionnaire was a part of a 2‑month campaign targeting different audience groups (people over 40 y of age). In the Czech Republic, cards with a QR code and a web link enabling the survey access were distributed to general practitioners and other specialists (cardiologists, internists, etc.). Each physician received about 30–50 cards, together with a cover letter explaining the objectives of the research. These cards were then distributed to hypertensive patients during their outpatient visit, and the patients were asked to complete the web‑based questionnaire. Participation was voluntary and the patients provided their consent when starting the questionnaire by selecting a specific field (consent was included in the questionnaire). All data were collected anonymously. Incomplete datasets were deleted, and quality criteria, such as the time to complete it, were defined to validate each questionnaire.
Statistical analysis
Descriptive statistics were used to summarize the study population and questionnaire responses. Continuous variables were reported as mean and SD for normally distributed data, or as median with interquartile range (IQR) for non‑normally distributed data. Categorical variables were expressed as counts and percentages. Normality of continuous variables was assessed using the Shapiro–Wilk test. The patients with missing data were excluded from the corresponding analyses (complete‑case analysis). Comparisons of categorical variables, including the presence of comorbidities, were performed using the χ² test of independence. Association analyses on the global set of data were done for age categorized into 5 predefined groups (20–49, 50–59, 60–69, 70–79, and ≥80 y). Body mass index (BMI) was also categorized into 5 groups (<18.5, 18.5–24.9, 25–29.9, 30–34.9, and ≥35 kg/m2). For continuous variables that did not meet the assumption of normality, comparisons across the countries were conducted using the Kruskal–Wallis test. When the global test was significant, pairwise comparisons between countries were performed using the Dunn post hoc test with the Bonferroni correction for multiple testing. For continuous variables with normal distribution, an analysis of variance was performed, followed by the Tukey test with the Bonferroni correction for multiple testing. The frequency of comorbidities according to sex was calculated for the entire set of data and for each country separately.
Four composite risk scores (medical, lifestyle, emotional, and nonadherence) were calculated based on responses to predefined questionnaire items, according to the previously described scoring methodology.15
The data were analyzed using Jeffreys’s Amazing Statistics Program (JASP Team 2024, version 0.95.1) from the University of Amsterdam. A P value below 0.05 was considered significant.
Results
In Table 1 we present the number of participants per country, their mean age, and sex distribution. Globally, the survey included 4256 valid answers, but 255 answers were excluded, because the patients were not on antihypertensive medications at the time of completing the survey. Thus, 4001 questionnaires were retained and analyzed. Mean (SD) age of the participants varied between 56.3 (13.7) years in the Czech Republic and 72.8 (6.3) years in the UK, with most of the participants being older than 60 years. The percentage of men varied between 45.1% in France and 72.1% in Poland.
Country | All participants, n (%) | Treated participants, n (%) | Age of the treated participants, y, mean (SD) | Men, % |
a P <0.001 vs each of the other countries | ||||
Czech Republic | 156 (3.6) | 151 (3.7) | 56.3 (13.7)a | 60.9 |
France | 601 (14.1) | 567 (14.2) | 71.6 (5.8) | 45.1 |
Germany | 577 (13.5) | 538 (13.4) | 71.7 (5.4) | 59.9 |
Italy | 564 (13.2) | 534 (13.3) | 71 (5.3) | 54.5 |
Poland | 1343 (31.5) | 1235 (30.8) | 63 (10.5)a | 72.1 |
Spain | 529 (12.4) | 510 (12.7) | 70.8 (6.1) | 63.3 |
United Kingdom | 486 (11.4) | 466 (11.6) | 72.8 (6.3) | 47.2 |
Grand total | 4256 (100) | 4001 (100) | 68.3 (9.2) | 59.7 |
Clinical characteristics of the population: comorbidities and medications
In Table 2 we present the main clinical characteristics and comorbidities of the participants. In the whole population, the total number of pills per day increased with age to a global average of 3.88 in the patients younger than 50 years and 5.2 in those older than 80 years; within countries the median number of pills remained stable across age groups. The 60–79 years age range drove nearly all intercountry variations. The participants from Spain, Italy, France, and Germany received a lower total number of pills, as compared with those from Poland and the UK. In contrast, neither age nor sex were associated with the number of antihypertensive medications, which was the highest in Poland (P <0.001 vs each of the other countries except for the Czech Republic).
Parameter | Czech Republic (n = 151) | France (n = 567) | Germany (n = 538) | Italy (n = 534) | Poland (n = 1235) | Spain (n = 510) | United Kingdom (n = 466) | P value |
Data are presented as percentage or median (interquartile range).
Abbreviations: AH, antihypertensive | ||||||||
Total number of pills | 4 (2–6) | 3 (1–5) | 4 (2–6) | 3 (2–5) | 4 (2–6) | 3 (1–5) | 5 (3–8) | <0.001 |
Number of AH pills | 1 (1–2) | 1 (1–2) | 2 (1–2) | 1 (1–2) | 2 (1–3) | 1 (1–2) | 2 (1–2) | <0.001 |
Number of AH pills/d | 1 (1–2) | 1 (1–2) | 2 (1–2) | 1 (1–2) | 1 (1–2) | 1 (1–1) | 1 (1–1) | <0.001 |
Nonsmokers | 64.9 | 56.1 | 36.1 | 40.1 | 50.5 | 43.1 | 58.4 | <0.001 |
Active smokers | 13.9 | 13.1 | 29.9 | 21.5 | 23.6 | 34.1 | 10.9 | <0.001 |
No regular physical activity | 10.6 | 30.2 | 35.1 | 35.6 | 41.5 | 17.6 | 39.8 | <0.001 |
Obesity | 51 | 31.5 | 20.5 | 28.6 | 52.9 | 24.7 | 32.4 | <0.001 |
Hypercholesterolemia | 43 | 28 | 42.2 | 46.8 | 37.5 | 48.3 | 44.6 | <0.001 |
Angina | 4.6 | 6.5 | 5.3 | 6.5 | 23 | 4.7 | 9.8 | <0.001 |
Heart failure | 2.6 | 8.2 | 12.8 | 5.2 | 14.6 | 5.9 | 5.1 | <0.001 |
Stroke | 3.3 | 3.8 | 7 | 1.6 | 4.2 | 1.7 | 6 | <0.001 |
Diabetes | 21.2 | 24.1 | 25.6 | 18.5 | 25.3 | 22.3 | 21.9 | 0.07 |
Chronic kidney disease | 7.9 | 6.5 | 4.8 | 6.3 | 5.4 | 20.5 | 6.8 | <0.001 |
Depression | 11.9 | 8.4 | 10 | 9.7 | 14 | 7.8 | 16.7 | <0.001 |
Sleep apnea syndrome | 14.5 | 24.7 | 18.9 | 20.2 | 33.7 | 22.3 | 22.3 | <0.001 |
As shown in Table 2, active smoking was more frequent in the countries such as Spain (34.1%) and Germany (29.9%), and lowest in the UK (10.9%). Italy and Germany had the highest percentage of former smokers, respectively 38.4% and 33.8%. Globally, around one‑third of the patients were not involved in any physical activity. Obesity was markedly more frequent in Poland (P <0.001) and the Czech Republic (P = 0.01) than in the other countries. Globally, the percentage of obesity based on the patient answers was 50.8% (95% CI, 43.9%–58.2%) at 40–49 years and 30.8% (95% CI, 28.4%–32.6%) in those aged 70–79 years. When assessed according to the calculated BMI, the percentage of patients with BMI greater than 30 kg/m2 was 56.6% in the age category of 50–59 years and 35.6% in that of 70–79 years.
As shown in Table 2, the percentage of patients with high cholesterol level was the lowest in France (28%). The percentage of patients with high cholesterol level was the lowest below the age of 50 years (33.3% in the 40–49 y group), but rather stable in the age categories above 50 years, ranging between 39% and 42%. Globally, high cholesterol level was as frequent in men as in women (41.5% and 39.1%, respectively). Age was associated with a high risk of diabetes (P <0.001). Diabetes was less frequent in women (P = 0.01). The percentage of patients with diabetes was lower in Italy (P <0.001), the UK (P = 0.01), and Spain (P = 0.01) than in Poland.
Kidney disease was reported more frequently in Spain than in any other country, and was associated with age (P = 0.046) but not sex. The proportion of patients with sleep apnea syndrome was the highest in the 50–59 years age category and the lowest in young (<50 y) and older patients (>70 y). Sleep apnea syndrome was particularly often reported in Poland (P <0.001 vs other countries). Stroke was reported more frequently in Germany (P = 0.01) and less frequently in Spain (P = 0.01) and Italy (P = 0.02) than in Poland. Heart failure was significantly more frequently reported in Poland, and was associated with older age.
Lifestyle, medical, emotional, and nonadherence risk scores and general level of stress according to country
The values of the calculated lifestyle, medical, emotional, and nonadherence risk scores corrected for age in the 7 countries are showed in Table 3. In general, the risk scores were low. Based on reported lifestyle answers, a significantly higher risk score was found essentially in Germany and Poland vs the other countries. Regarding the medical and emotional risk scores, they were the highest in Poland (P <0.001). The nonadherence risk score was low in the studied populations (1.1–2.5 on a 0–25 scale). The highest median (IQR) scores were found in the Czech Republic and Poland. All other nonadherence risk scores were below 1.6.
Risk scorea | Czech Republic (n = 151) | France (n = 567) | Germany (n = 538) | Italy (n = 534) | Poland (n = 1235) | Spain (n = 510) | United Kingdom (n = 466) | P value |
Data are presented as median (interquartile range).
a Lifestyle score range was 0–8; medical, 0–22; emotional, 0–8; and nonadherence, 0–25 points.
b Significantly different from all other countries except Germany
c Values significantly higher than in all other countries
d Poland and the Czech Republic had significantly higher values than each of the other countries. No difference was observed between Poland and the Czech Republic. | ||||||||
Lifestyle (n = 3682) | 3 (2–4) | 2 (1–3) | 3 (2–4) | 2.5 (2–4) | 3 (2–4)b | 3 (1–4) | 3 (2–4) | <0.001 |
Medical (n = 3682) | 4 (2–6) | 4 (1–6) | 4 (2–7) | 4 (2–6) | 5 (3–7)c | 4 (3–6) | 4 (3–7) | <0.001 |
Emotional (n = 4001) | 3 (2–5) | 3 (2–5) | 3 (2–4) | 3 (2–5) | 4 (3–6)c | 3 (2–5) | 3 (2–5) | <0.001 |
Nonadherence (n = 4001) | 1 (0–3)d | 0 (0–1) | 0 (0–1) | 0 (0–1) | 0 (0–3)d | 0 (0–1) | 0 (0–1) | <0.001 |
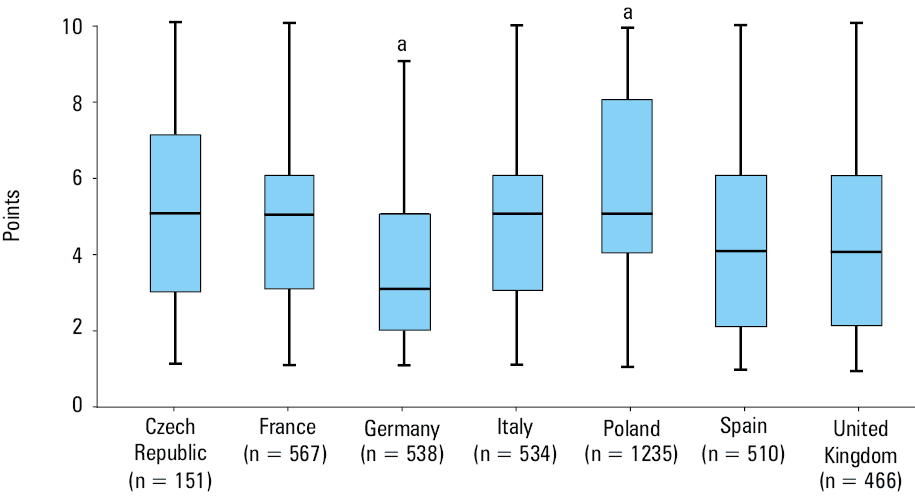
Figure 1 presents the level of general stress perceived by the patients based on a 1–10 numeric scale. Differences between the countries were substantial (P <0.001), with the lowest level of stress in Germany and the highest in Poland. The number of pills and female sex were associated with higher values of general level of stress.
a Significant difference (P <0.001) vs all other countries
Frequency of follow‑up medical visits in chronically treated hypertensive patients
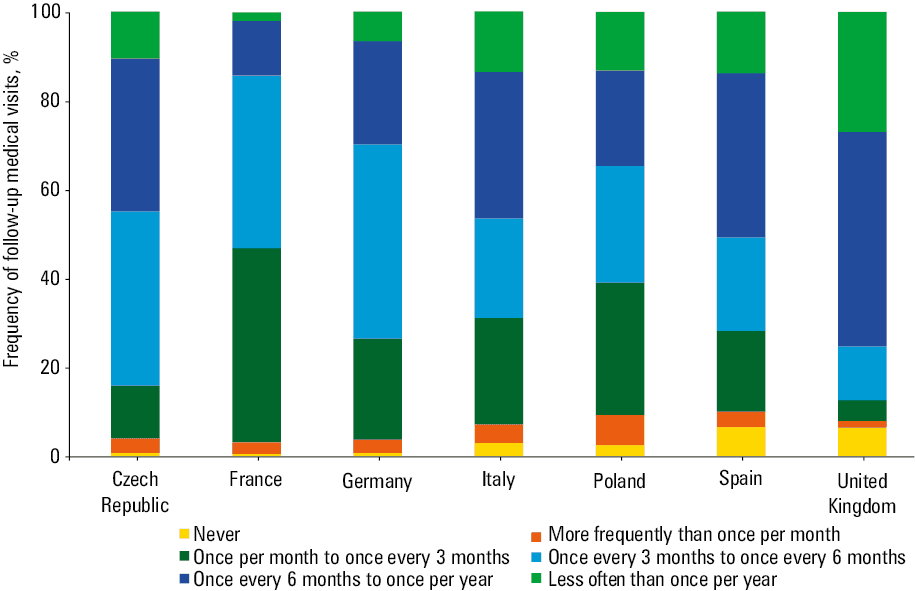
The frequency of medical visits at which the hypertensive patients were followed‑up by their general practitioners or specialists is showed in Figure 2. Large differences in the frequency of medical appointments were observed between the countries (P <0.001). The patients in France reported the highest rate of medical appointments, with 45%–55% of them consulting a physician once every 1–3 months. Countries with the lowest rate of medical appointments were the UK and Spain, with physicians consulting the patients usually once to twice a year or rarer than once a year.
Out of office blood pressure measurements
The proportion of the participants reporting self‑BP monitoring at home was relatively high in the whole population (75%), and it was greater in men than women (78.7%; 95% CI, 77%–80.3% vs 71.3%; 95% CI, 69.1%–73.5%; P <0.001). The lowest use of home BP monitoring (HBPM) was reported in France (52%) and the highest in Poland (92.6%; P <0.001). Regarding the effect of age, there was an age trend with younger patients monitoring their home BP more frequently (91.3%) than older patients (64.3%; P <0.001). However, the age effect was found only in France and the UK.
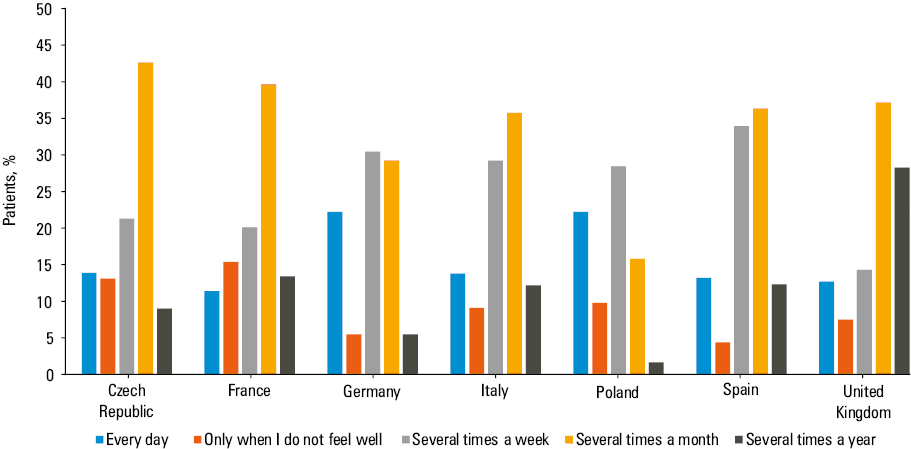
Figure 3 shows the frequency at which the patients reported measuring BP at home. The pattern differed between the countries (P <0.001). Most often BP was measured at home several times a week or month (once a month being more frequent than once a week; P = 0.002). Of note, in Poland, about 40% of the patients reported measuring their BP every day.
Information received from health care professionals
When the patients were asked if they received information on the goals of therapy and on the characteristics of their treatment (duration, side effects, etc.) from any health care professional (general practitioner, specialist, nurse, or pharmacist) when starting their antihypertensive therapy, the number of positive answers varied greatly between the countries, from 55% in Poland to 78% in the Czech Republic (Supplementary material, Table S1). However, many patients would have appreciated receiving more information on these topics, that is, 9.3%, 9.7%, and 9% in the Czech Republic, France, and the UK, and 10.8%, 13.3%, 10.9, and 18.2% in Germany, Italy, Poland, and Spain, respectively (Supplementary material, Table S1).
As shown in Table 4, at the time of completing the survey, the patients would have appreciated getting more information on hypertension in general, on their treatment, its complications, side effects of antihypertensive medications, and practical aspects of hypertension management. The need for information on treatment showed the strongest variations between the countries (P <0.001). There was no difference across the countries regarding the level of information on side effects. Globally, Poland had the highest demand for additional information and Germany and the UK the lowest.
More information requested on | Czech Republic (n = 151) | France (n = 567) | Germany (n = 538) | Italy (n = 534) | Poland (n = 1235) | Spain (n = 510) | United Kingdom (n = 466) | P value |
Data are presented as percentage. | ||||||||
Hypertension in general | 12.6 | 22.6 | 10.6 | 22.1 | 24.8 | 24.5 | 16.7 | <0.001 |
Hypertension treatment | 7.3 | 11.3 | 7.2 | 15.7 | 18.9 | 14.7 | 8.1 | <0.001 |
Hypertension complications | 15.9 | 22.2 | 13.0 | 20.2 | 25.4 | 23.3 | 15.2 | <0.001 |
Side effects | 26.5 | 23.1 | 19.3 | 19.3 | 20 | 18.6 | 22.3 | 0.11 |
Practical information | 14.6 | 8.1 | 9.1 | 5.4 | 8.8 | 7.8 | 5.4 | <0.001 |
Attitude toward antihypertensive medications
The frequency at which the patients from each country stopped their medications or modified the prescribed dose without consulting their health care provider is showed in Table 5. Intentional interruptions of antihypertensive treatment ranged between 10% and 20%. As expected, unintentional interruptions were frequent in all countries. Modification of medication doses without referring to the health care provider was also common, particularly in Poland. The frequency at which the Polish patients modified their treatment was more than 2‑fold higher than that for the French patients. Other countries did not differ in this regard. Finally, in all countries, medications were frequently taken irregularly during the day, with about half of the patients admitting to this pattern. The Spanish patients most strictly adhered to therapy and showed a significantly lower prevalence of treatment modifications. No difference was observed between other countries in this respect. These observations are in accordance with the nonadherence risk score (Table 3).
Parameter | Czech Republic (n = 151) | France (n = 567) | Germany (n = 538) | Italy (n = 534) | Poland (n = 1235) | Spain (n = 510) | United Kingdom (n = 455) | P value | ||
Data are presented as percentage. | ||||||||||
Intentional interruption of treatment | Never | 80.1 | 87.8 | 92.2 | 85.5 | 81.5 | 87 | 89.2 | <0.001 | |
Sometimes / rarely | 17.2 | 11.4 | 7.4 | 14 | 17.4 | 11.5 | 10.3 | |||
Unintentional interruption of treatment | Never | 41 | 76.7 | 70.4 | 74.5 | 68.5 | 78 | 73.6 | <0.001 | |
Sometimes / rarely | 54.9 | 22.2 | 29.2 | 25.2 | 29.8 | 20.6 | 25.3 | |||
Modification of the treatment dose | Never | 85.4 | 90.1 | 84.5 | 85 | 74.7 | 87.6 | 88.2 | <0.001 | |
Sometimes / rarely | 11.9 | 9.2 | 14.6 | 14.2 | 22.6 | 10.7 | 10.5 | |||
Irregular intake of medications during the day | Never | 53.6 | 64.7 | 57.2 | 57.6 | 60.7 | 74.3 | 61.6 | <0.001 | |
Sometimes / often | 13.3 | 11.3 | 10.8 | 14.1 | 16.5 | 10.6 | 13.7 | |||
Discussion
The results of our analysis, comparing several aspects of the hypertension management in 7 European countries according to the patient’s point of view, showed the following: 1) there are significant differences in the clinical characteristics and cardiovascular risk profile between the countries, with a higher cardiovascular risk in Poland and lower risk in southern countries, such as Spain or Italy; these differences are supported by the calculation of the lifestyle, medical, and emotional risk scores; 2) the total number of prescribed drugs and the number of antihypertensive medications are higher in the countries with a higher cardiovascular risk score; 3) significant differences are found in the frequency at which the patients meet their physicians for hypertension follow‑up, with the highest rate in France and the lowest in Spain and the UK; 4) the use of HBPM is frequent in all countries but the lowest in France (52%) and the highest in Poland (>90%); 5) in all countries, a majority of the patients felt they had received enough information about their antihypertensive treatment (range, 55%–80%). Yet, 10%–20% of the patients would appreciate more information, mainly on drug side effects and hypertension complications; 6) finally, the nonadherence risk score as reported by the patients was low in all countries, and nonintentional interruption of therapy was the main cause of poor adherence (about 25%). Most patients admitted to taking their antihypertensive medications irregularly during the day (range, 53%–74%).
CVDs represent the most common cause of death in the European countries, and 2021 statistics of the ESC showed that the burden of CVDs is generally higher in Central and Eastern Europe than in Northern, Southern, and Western Europe.16 In addition to socio‑economic and environmental reasons, the differences between Eastern European countries and the rest of the continent are explained by greater prevalence of clinical risk factors, such as hypertension, dyslipidemia, obesity, and diabetes, and behavioral risk factors, such as unhealthy diet, lack of physical activity, smoking, and alcohol use.16 Our baseline data obtained from 4001 treated hypertensive patients (mean age, 68.3 [9.2] y) tend to confirm the ESC statistics (Table 2). Interestingly, the prevalence of dyslipidemia was rather high but similar in all countries from our survey, except in France, where it was low at 28%. This surprising finding is actually supported by the recent data of the ESTEBAN observational survey (Health study on environment, biomonitoring, physical activity, and nutrition), in which biological and clinical examinations were obtained in 3021 adults aged 18–74 years from the general French population.17 In that survey, the prevalence of hypercholesterolemia was 23.3% (27.8% in men, 19% in women).
Another surprising Figure is the high frequency of chronic kidney disease (CKD) reported in Spain (20.5%), which is 2–4‑fold higher than that reported in other countries. The prevalence of CKD is generally assumed to be 10% in Western Europe and 13% in Central and Eastern Europe.18 However, an important consideration is that less than 10% of the affected patients actually know they have this condition.19 Although one cannot exclude a selection bias, the Figure reported by the Spanish participants may also reflect greater awareness of the disease in Spain rather than true higher prevalence of CKD.
Several other noticeable differences between the European countries may be emphasized. For example, our survey showed that countries such as Poland, the Czech Republic, and sometimes Germany had significantly higher risk scores regarding lifestyle habits, medical complications, emotional status, quality of life, and self‑perceived stress level, as compared with the southern countries. This may reflect some environmental and socio‑economic factors. Yet, one cannot conclude that these observations reflect the global profile for the entire country’s population due to the small number of participants from each country and the possibility of a selection bias. Nevertheless, it is interesting to note that the number of pills, and more specifically the number of BP lowering pills, taken daily by the participants, were also significantly higher in these countries. The level of stress was associated with the number of pills patients had to take every day.
The ESH guidelines recommend achieving BP control within the first 3 months after initiating therapy, if possible, but there are no clear instructions on how frequently patients should meet their physicians or any other health care provider during follow‑up.1 As shown in Figure 2, there is a large heterogeneity between the countries in terms of follow‑up, with frequent medical consultations in France (once a month or once every 3 months) and very infrequent consultations (1–2 or fewer per year) in Spain or the UK. This large variability, which may be linked to local medical practice habits and country‑specific reimbursement policies, may explain why it is difficult to make more specific recommendations in guidelines. The frequency of follow‑up visits might be importantly affected by the inherent problems of individual health system, the issue of copayment, and the overload of some health care systems.20 Our Figures are supported by recent findings in France, where the mean number of visits for hypertensive patients followed in primary care was 12.8 (9.3) per year, that is, about once a month, but it was associated with an optimal BP control rate (about 50% of treated hypertensive patients).21 However, there was no clear correlation between the number of consultations and the quality of BP control as discussed below. Therefore, it seems that access to medical care is not the main reason for poor BP control.
HBPM has been recommended by the hypertension guidelines for almost 2 decades.1-3,22 Among other advantages, HBPM offers the possibility of confirming the hypertension diagnosis based on repeated out‑of‑office measurements with none or limited white‑coat effect, and to empower patients in the management of their disease.23 Yet, a recent survey, including 22 177 HBPM users from 190 countries (the United States, Germany, the UK, and France representing 80% of the users), has shown that only 54% of them were persistent during the first year, suggesting a rather low long‑term implementation of the recommendation.24 The survey provided none between‑country comparisons.24 In our survey, HBPM was frequently used in all countries but with variability ranging from 52% in France to 92% in Poland, a country where HBPM is strongly recommended by hypertension specialists. Figure 3 shows also great variability in the pattern of HBPM use between the countries. The most frequent pattern in our survey was to measure BP at home several times a month or several times a week. In this respect, our Figures obtained in Germany align with those published by Beger et al25 in a similar German population. In their survey, 24% of German hypertensive patients measured their BP every day. In Poland, 41% of the patients reported measuring BP at home every day. In fact, these patterns do not align with the latest ESH guidelines suggesting using a strict protocol for HBPM.1
An important determinant of HBPM acceptance in the population is the possibility of buying a measuring device. As published previously, HBPM devices are not reimbursed in most European countries except for Germany and Spain.20 This may explain why 62.3% of the German patients with hypertension had the device, whereas in France 42% of hypertensive patients and 20% of the general population own a BP measuring device.25,26 Yet, in Poland, a very high percentage of the participants measured their BP at home, even though BP monitoring devices were not reimbursed. Some important issues regarding HBPM, such as the accuracy of home measurements or the reporting of BP values to physicians were not addressed in our survey. Data from Italy have shown that knowledge on correct HBPM performance is low among patients followed in hypertension centers,27 and recent results from a United States survey have shown that a large percentage of hypertensive patients lack knowledge and cannot interpret BP measurements adequately.28 Moreover, data are not always transmitted by patients to their physicians,29 and the latter are not always adequately trained and equipped to handle and analyze the data.30
In a previous survey conducted among the ESH Centers of Excellence, we reported that most physicians had limited time (mainly <10 min) to discuss the goals of treatment and antihypertensive medications during their consultations, and few of them actually involved their patients into therapeutic decision‑making.31 This could have a major impact on the quality of information provided to the patients. In the present survey, the patients were asked about the quality of the information they received, and if they would like to have more information on given topics. Globally, a large proportion of patients (between 55% in Poland and 78% in the Czech Republic) answered that a sufficient amount of information was provided. Yet, as shown in Table 4, 10%–25% of the patients would have liked more information particularly on medication side effects (no significant difference between countries), complications of hypertension, and hypertension in general. These results confirm those of Kusch et al32 from Germany who found that side effects and drug–drug interactions are the most frequently requested information. Large studies on the quality of information provided by physicians to their patients are rare, even though this topic should be a part of any assessment of the quality of care. Today, patients have numerous opportunities to obtain information on hypertension from high‑quality leaflets,33 dedicated websites, social media, or other sources. Nevertheless, it seems that many patients would prefer receiving this type of information directly from their health care providers. The results of a previous study on the impact of patient information leaflets tend to confirm this hypothesis.34
Lack of adequate information or knowledge is a frequent28 and important determinant of poor patient adherence to medications.34,35 Therefore, our survey also assessed the patient attitudes toward the prescribed medications. As reported previously,15 intentional interruptions of treatment are uncommon in all countries, and the main cause of poor adherence are unintentional interruptions. Moreover, in most countries, 10%–15% of the patients modified the prescribed dose of their antihypertensive drug, and this was most frequent in Poland (22.6%). This would suggest that Polish hypertensive patients may require enhanced medication management support and targeted interventions to reduce self‑initiated treatment modifications.
Limitations
This survey has several important limitations, which may affect generalizability of the conclusions. First, the inclusion criteria were wide (treated hypertensive patients), so one cannot exclude a selection bias, such as preferential inclusion of motivated patients with internet access. Second, we do not have information on the total number of the individuals who were approached in each country, and how many of them agreed to participate. Moreover, we do not know how much those who completed the questionnaire differed from those who did not. Thus, whether the studied populations are truly representative of each country could be questioned. Third, the recruitment methods differed between the 5 initial countries (France, Germany, Italy, Spain, and the UK) and Poland and the Czech Republic. Therefore, there were significant differences in the number of enrolled patients and some heterogeneity among the data collected in individual countries. Poland enrolled over 1200 patients, while 156 responses were obtained in the Czech Republic, and the mean age was significantly lower in Poland and the Czech Republic than in the other countries. A narrative review has recently emphasized the need to give more attention to older patients with frailty when assessing the management of hypertension.36 Therefore, some cross‑country comparisons might have limited validity despite statistical corrections. Hence, these comparisons should be interpreted mainly as descriptive. Fourth, we did not have detailed information on other drug therapies except for the total number of pills taken every day, and the patients did not provide data on the frequency of adverse events they experienced during antihypertensive treatment.
Unfortunately, we did not have access to recent valid BP measurements enabling us to assess whether the patient attitudes or perceptions were associated with the quality of BP control. Yet, we do have data on BP control from these countries coming from national surveys in the same type of hypertensive populations. Thus, the percentage of treated hypertensive patients with BP below 140/90 mm Hg was 49.5% in the Czech Republic,37 49.7% in France,38 40.8% in Germany,25 60.6% in Italy,39 around 42% in older Polish patients (difference between men and women),40 63% in Spain,41 and 38% in the UK Biobank.42 Interestingly, using these Figures from the literature, significant negative correlations were found between the rate of BP control in various countries and the number of prescribed antihypertensive pills (r = –0.856; P = 0.007) and the medical risk score (r = –0.776; P = 0.02).
Perspectives
Our assessment of the patient opinion on the management of their hypertension in 7 European countries provides important insights on high variability of hypertension management despite using the same European hypertension guidelines. Our results confirm the known differences in cardiovascular risk between European countries, and may provide some food for thought on what needs to be done to improve BP control in Europe. Some ways might be to improve the education and information provided to patients to offer them more control or to improve collaboration with health care professionals, such as pharmacists and nurses in the context of team‑based care to ameliorate the follow‑up and educational processes.43 Greater involvement of patient representatives in guideline development could also decrease the gap between the guidelines and patient preferences and experiences, as already implemented in some national guidelines.1-6
- Mancia G, Kreutz R, Brunstrom M, et al. 2023 ESH Guidelines for the management of arterial hypertension: the Task Force for the management of arterial hypertension of the European Society of Hypertension: endorsed by the International Society of Hypertension (ISH) and the European Renal Association (ERA). J Hypertens. 2023; 41: 1874‑2071. | Crossref
- McEvoy JW, McCarthy CP, Bruno RM, et al. 2024 ESC Guidelines for the management of elevated blood pressure and hypertension. Eur Heart J. 2024; 45: 3912‑4018. | Crossref
- Unger T, Borghi C, Charchar F, et al. 2020 International Society of Hypertension Global Hypertension practice guidelines. Hypertension. 2020; 75: 1334‑1357. | Crossref
- Jones DW, Ferdinand KC, Taler SJ, et al. 2025 HA/ACC/AANP/AAPA/ABC/ACCP/ ACPM/AGS/AMA/ASPC/NMA/PCNA/SGIM Guideline for the prevention, detection, evaluation, and management of high blood pressure in adults: a report of the American College of Cardiology / American Heart Association Joint Committee on clinical practice guidelines. Circulation. 2025; 152: e114‑e218. | Crossref
- Kreutz R, Brunstrom M, Burnier M, et al. 2024 European Society of Hypertension clinical practice guidelines for the management of arterial hypertension. Eur J Intern Med. 2024; 126: 1‑15. | Crossref
SUPPLEMENTARY MATERIAL
ARTICLE INFORMATION