
Vitamin D concentration is associated with enhanced neutrophil extracellular traps formation in type 2 diabetes: the effect of glycemic control

 CC BY 4.0
Vitamin D concentration is associated with enhanced neutrophil extracellular traps formation in type 2 diabetes: the effect of glycemic control
CC BY 4.0
Introduction
Neutrophil extracellular traps (NETs), composed of DNA, histones, and granular proteins, play an important role in innate immunity,1 but also in chronic and low‑grade inflammatory states.2 NETs formation (NETosis) can be indirectly evaluated by measuring levels of circulating NETs‑associated proteins, such as citrullinated histone 3 (citH3), cell‑free DNA (cfDNA), myeloperoxidase (MPO), and neutrophil elastase (NE).2 Increased levels of NET‑associated proteins have been reported in a vast array of diseases, including type 2 diabetes mellitus (T2DM).2,3 Compelling basic and clinical data support enhanced NETosis under high‑glucose conditions and confirm the occurrence of NETs‑mediated harmful effects in T2DM, including macro- and microvascular manifestations, impaired wound healing, and retinopathy.4-7 Cardiovascular complications (eg, myocardial infarction) in patients with T2DM have been attributed at least in part to increased NETosis, which renders fibrin clots more prothrombotic and impairs fibrinolysis.3
There is evidence that T2DM patients are often impacted by micronutrient deficiencies, most commonly vitamin D deficiency, which affects around 60% of the diabetic population8 and may impair metabolic control.9 Both impaired pancreatic β-cell function and insulin resistance have been reported to correlate with low blood concentrations of 25‑hydroxyvitamin D.9 Vitamin D supplementation is recommended in adults with prediabetes to reduce the rate of progression to T2DM.9 Although a growing body of evidence has downplayed the role of vitamin D supplementation in T2DM,10 some studies have demonstrated a reduction in glycated hemoglobin (HbA1c) concentration following such an intervention.11 It has been shown that in ex vivo high‑glucose conditions, vitamin D may decrease NETosis, suggesting the potential of vitamin D supplementation for the prevention of NETs‑associated adverse events.12 Additionally, vitamin D was shown to positively affect wound healing in T2DM, at least in part due to decreased NETosis.13 To our knowledge, no study yet has investigated the potential association between vitamin D status and NETosis in patients with T2DM in relation to glycemic control. The aim of our study was to investigate whether vitamin D deficiency was associated with enhanced NETosis in T2DM patients, and to establish whether vitamin D concentrations might be linked to fibrin clot parameters and thrombin generation in T2DM.
Patients and methods
We included 115 patients diagnosed with T2DM in a tertiary‑care center in Kraków, Poland between October 2016 and July 2017. This population was presented in detail previously.3,14 A total of 13 patients were excluded from the current analysis due to unavailable data on 25‑hydroxyvitamin D concentration. Other exclusion criteria comprised advanced chronic kidney disease, autoimmune disorders, cancer, signs of acute infection, and recent arterial or venous thromboembolic events. Microalbuminuria was defined as the urinary albumin to creatinine ratio within the range of 30–300 mg/g, whereas macroalbuminuria was considered if this ratio was above 300 mg/g.
The study protocol was approved by the Jagiellonian University Medical College Bioethics Committee (1072.6120.40.2017). All participants provided written informed consent.
Fasting venous blood samples were collected between 8 and 10 AM. Routine laboratory investigations were performed at the hospital laboratory. HbA1c concentrations were analyzed using the Variant II Turbo analyzer (Hercules; reference range, 4.8%–5.9%). All samples were stored at –80 °C until further analysis.
Serum level of 25‑hydroxyvitamin D (including vitamin D2 and vitamin D3) was measured using an enzyme‑linked immunosorbent assay (ELISA; Abcam). Individuals with vitamin D deficiency (<20 ng/ml) and those with insufficient vitamin D concentration (20 to <30 ng/ml) were analyzed together as a group with nonsufficient vitamin D concentration and compared with the group with sufficient vitamin D concentration (≥30 ng/ml).15
Among the NETs‑associated proteins, MPO, NE (Abcam), and citH3 (Cayman Chemical) levels were evaluated using ELISAs, while cfDNA level measurements were performed using a commercially available assay (Invitrogen, Life Technologies). The reference range for citH3 established in our laboratory was 0.5–1.7 ng/ml. Interleukin (IL)-6 and IL‑8 concentrations were also determined by ELISA (R&D Systems).
Thrombin generation potential was evaluated using a previously described assay,3 and was expressed by the area under the curve. Fibrin clot characteristics were expressed as permeation coefficient (Ks) and clot lysis time (CLT), according to previously described techniques.3
Statistical analysis
Statistical analysis was conducted using IBM SPSS Statistics for Windows, version 31 (IBM Corp.). Categorical data are presented as number (percentage), while continuous variables are shown as median (interquartile range [IQR]) or mean (SD) for non‑normally and normally distributed variables, respectively. Significance of intergroup differences for qualitative parameters was evaluated using the Fisher exact test (when the expected count in any cell of a contingency Table was <5) or the χ2 test with Yates correction (correction applied if all expected counts were ≥5, while the observed value in at least 1 cell was <10). Normality of the distribution of continuous variables was tested using the Shapiro–Wilk test, and homogeneity of variance using the Levene test. Intergroup differences in continuous data were assessed using the Mann–Whitney test and t test for normally and non‑normally distributed variables, respectively. Evaluation of correlations between 2 parameters was performed using the Spearman correlation coefficient with nonparametric curve fitting if at least 1 of the tested variables was non‑normally distributed. A 2‑sided P value below 0.05 was considered significant.
Results
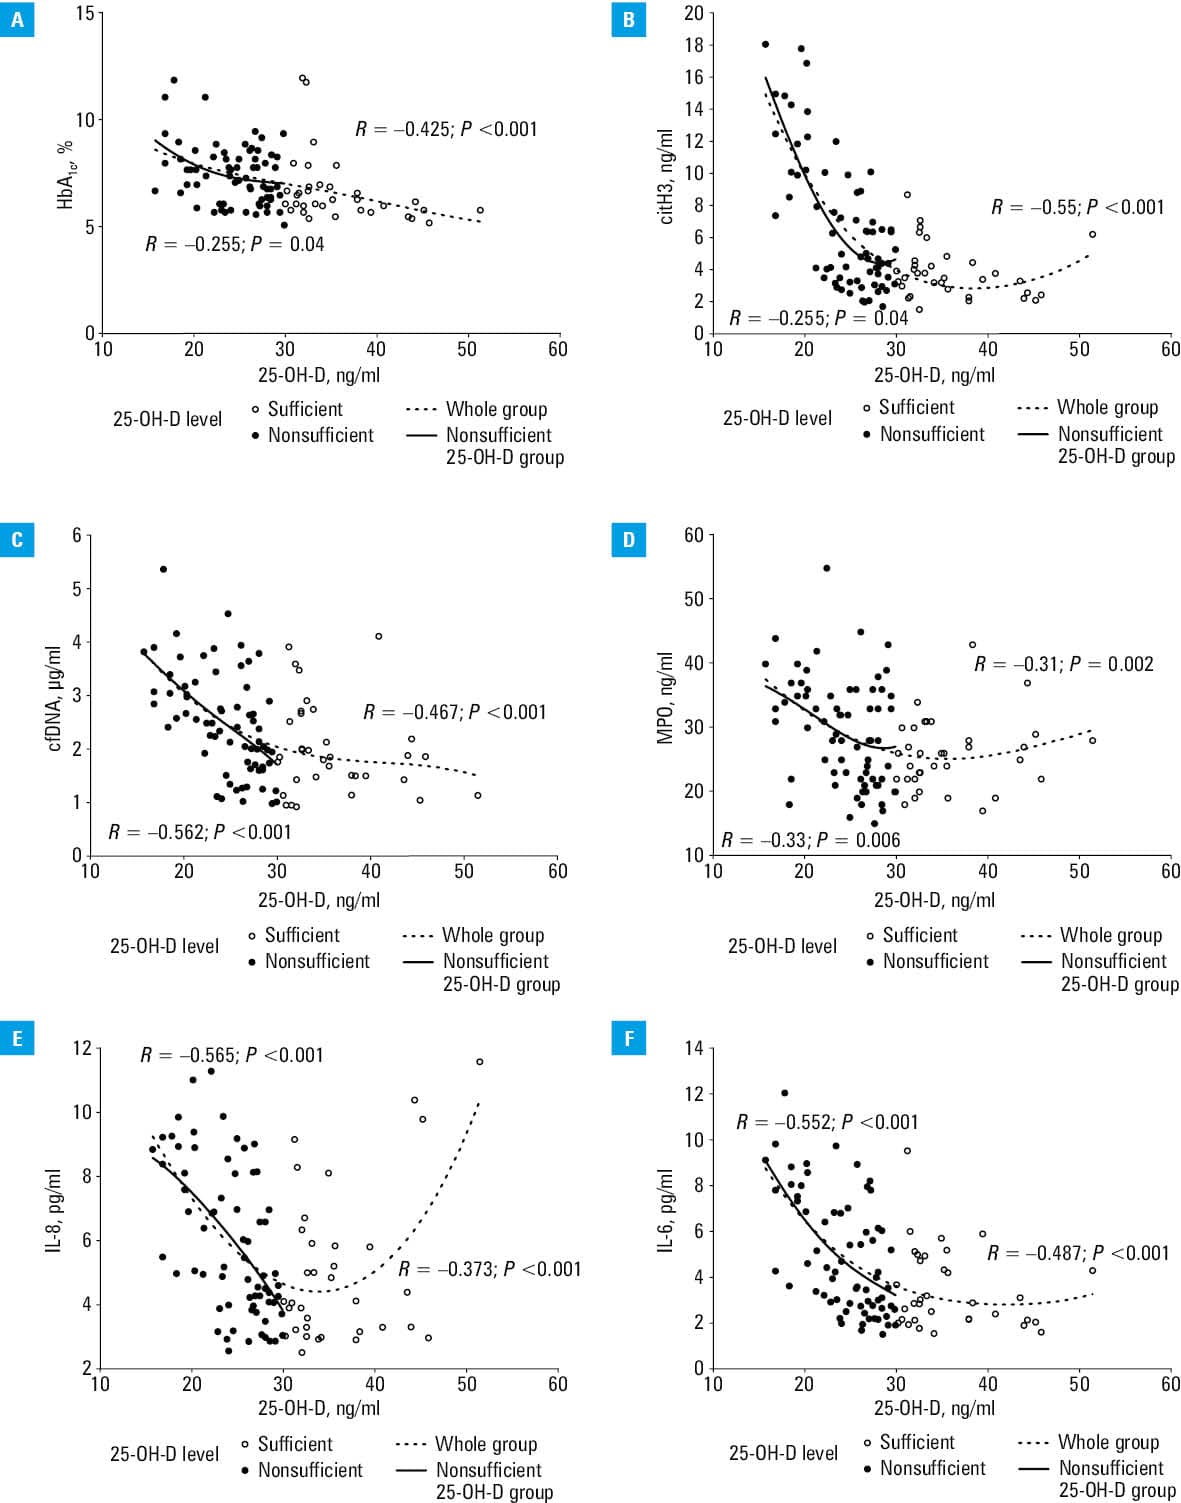
A total of 102 patients at a mean (SD) age of 64.4 (8.2) years were analyzed. Over a half of the study population were men (n = 55; 54%). Median (IQR) HbA1c concentration was 6.9% (6%–8.05%), and median vitamin D level in the whole population was 27.5 (23.5–32) ng/ml. Most of the patients (n = 68; 66.7%) had a nonsufficient vitamin D concentration (Supplementary material, Table S1), with a median value of 25.3 (21.5–27.6) ng/ml in this group. In the patients with sufficient vitamin D concentration, the median value was 33.6 (32–38.6) ng/ml. Vitamin D status showed no associations with demographic and clinical variables or with taking antidiabetic medications (Supplementary material, Table S1). In the patients with nonsufficient vitamin D level, the concentration of HbA1c was by 20.3% higher, and serum glucose concentration was by 18.7% higher than in the individuals with sufficient vitamin D level (Supplementary material, Table S1). Moreover, vitamin D level correlated negatively with HbA1c concentration, both in the whole group and in the subgroups with nonsufficient and sufficient (R = –0.46; P = 0.006) vitamin D concentrations (Figure 1A). A correlation of vitamin D level with serum glucose concentration was observed solely in the whole group (R = –0.311; P = 0.001).
The patients with nonsufficient vitamin D concentration had by 47.1% higher citH3 levels, by 32.4% higher cfDNA, and by 13.6% higher MPO concentrations, as compared with the remainder (Supplementary material, Table S1). The groups did not differ with respect to circulating NE levels (Supplementary material, Table S1). Moreover, the patients with nonsufficient vitamin D concentration had by 47.4% higher IL‑6 levels, while IL‑8 concentrations did not differ (Supplementary material, Table S1).
The levels of NETs‑related proteins, except for NE, were associated with vitamin D status in the whole study population and in the group with nonsufficient vitamin D concentration (Figure 1B–1D). Similarly, we observed associations of vitamin D concentration with IL‑8 and IL‑6 levels in the whole population and in the patients with nonsufficient vitamin D levels (Figure 1E and 1F).
There were no differences in thrombin generation potential and Ks according to vitamin D status. The patients with nonsufficient vitamin D concentration had by 13.7% prolonged CLT, as compared with those with sufficient vitamin D concentration (Supplementary material, Table S1). We found weak associations of vitamin D levels with both Ks and CLT in the whole group (R = 0.248; P = 0.01 and R = –0.392; P <0.001, respectively) and in the patients with nonsufficient vitamin D concentration (R = 0.326; P = 0.007 and R = –0.298; P = 0.01, respectively). The vitamin D concentration did not correlate with thrombin generation potential.
Discussion
This study is the first to demonstrate that vitamin D status may contribute to the modulation of NETosis in patients with T2DM. Importantly, glycemic control was also associated with NETs‑related proteins. Our findings extend beyond NETosis, and suggest that vitamin D deficiency may affect the fibrin clot phenotype, particularly fibrinolysis. The patients with lower vitamin D concentrations formed fibrin networks that were relatively resistant to lysis, despite no differences in fibrinogen levels or thrombin generation.
The interpretation of associations between NETs‑related proteins and vitamin D status in individuals with T2DM remains complex, and may involve at least 2 mechanisms. One of them is a possible direct effect of vitamin D on NETosis. The other explanation is indirect and related to glycemic control. The patients with nonsufficient vitamin D concentration had increased HbA1c levels, supporting the hypothesis that suboptimal vitamin D status contributes to impaired glycemic control,11 which in turn may exacerbate NETosis.5 Our research group previously showed that the level of HbA1c predicts citH3 concentration in T2DM.3 The current findings expand this observation by placing vitamin D within the network of processes associated with NETosis in T2DM.
However, previous data from studies showing that vitamin D supplementation inhibits NETosis in response to high glucose concentration12,13 point towards the hypothesis of a direct impact. In line with these data, we observed increased levels of citH3, cfDNA, and MPO in the patients with nonsufficient vitamin D concentration. Importantly, a similar vitamin D cutoff had previously been linked to an increased risk of cardiovascular disease and T2DM.16 Therefore, enhanced NETosis associated with vitamin D deficiency may represent a previously unrecognized factor contributing to cardiovascular complications in T2DM. Moreover, our study showed that only cfDNA level correlated with that of HbA1c, whereas the levels of other NETs‑related proteins did not. This discrepancy suggests that circulating cfDNA in T2DM may not be driven exclusively by NETosis, but also by other factors, such as endothelial injury. Endothelial dysfunction is a hallmark of diabetes and is driven by chronic hyperglycemia and oxidative stress.4
Our findings also support the hypothesis that vitamin D deficiency may contribute to prothrombotic alterations, mainly via impaired fibrinolysis. This is with line with a study by Varjú and Longstaff,17 who demonstrated that extracellular DNA and histones can directly modulate fibrin clot structure and CLT. Their study provides a mechanistic link between NETs components and unfavorably altered clot properties.17 Evidence regarding the role of vitamin D in fibrin clot properties is very limited. Previous interventional studies showed that vitamin D supplementation can modulate thrombin generation and fibrin clot architecture, leading to the formation of less dense and potentially less thrombogenic fibrin networks. However, these changes were not consistently accompanied by alterations in CLT.18 In contrast, Elbers et al19 failed to show significant effects of vitamin D supplementation on fibrinolysis. In our cohort, the patients with nonsufficient vitamin D concentrations had prolonged CLT despite comparable concentrations of fibrinogen, C‑reactive protein, and activities of α-2‑antiplasmin and plasminogen, relative to the remainder. IL‑6 was the only parameter whose level differed between the groups and was increased in the patients with nonsufficient vitamin D concentrations. Interestingly, vitamin D supplementation has also been associated with lower levels of oxidative stress markers in T2DM patients.11 This highlights the complexity of the mechanisms linking vitamin D, NETosis, and neutrophil activation. Our findings indicate the presence of a complementary mechanism connecting vitamin D deficiency with enhanced NETosis and impaired fibrinolysis in T2DM. In our opinion, the association between vitamin D and CLT may be particularly relevant in T2DM because hyperglycemia‑induced IL‑6 secretion may promote NETosis. Further studies are needed to determine whether vitamin D supplementation may inhibit NETosis in the diabetic milieu and improve clot properties.
The potential influence of pharmacotherapy should also be considered. Previous studies reported reductions in the levels of NETs‑associated proteins with high‑dose statin therapy.20 We did not observe such effects, likely due to lower statin doses in our patients. Similarly, antidiabetic therapies were not associated with vitamin D status or the levels of NETs‑associated proteins, although subgroup analyses were limited by the small sample size.
Limitations
This study has several limitations. First, the sample size was relatively small and the presented associations do not necessarily indicate a cause‑effect relationship. Second, seasonal variation in vitamin D concentrations across the calendar year was not considered and may have affected the results. Future studies should include repeated measurements across seasons with different levels of sun exposure.21 Third, the molecular mechanisms underlying vitamin D–mediated modulation of NETosis were beyond the scope of this study. Additionally, no follow‑up was conducted, so we could not determine whether the observed differences predispose patients to arterial or venous thromboembolism. Finally, it remains unclear whether vitamin D supplementation can reduce NETosis independently of glycemic control. Therefore, the present study should be considered hypothesis‑generating, and its findings should be interpreted cautiously.
Conclusions
Nonsufficient concentrations of vitamin D in T2DM patients were associated with enhanced NETosis detectable in circulating blood and with impaired fibrinolysis. These findings suggest that vitamin D may partly modulate thrombotic risk in T2DM. Further mechanistic and interventional studies are needed to determine whether vitamin D supplementation can attenuate NETosis and improve fibrinolytic efficiency in T2DM.
- Papayannopoulos V. Neutrophil extracellular traps in immunity and disease. Nat Rev Immunol. 2018; 18: 134‑147. | Crossref
- Natorska J, Ząbczyk M, Undas A. Neutrophil extracellular traps (NETs) in cardiovascular diseases: from molecular mechanisms to therapeutic interventions. Kardiol Pol. 2023; 81: 1205‑1216. | Crossref
- Bryk AH, Prior SM, Plens K, et al. Predictors of neutrophil extracellular traps markers in type 2 diabetes mellitus: associations with a prothrombotic state and hypofibrinolysis. Cardiovasc Diabetol. 2019; 18: 49. | Crossref
- Wang L, Zhou X, Yin Y, et al. Hyperglycemia induces neutrophil extracellular traps formation through an NADPH oxidase‑dependent pathway in diabetic retinopathy. Front Immunol. 2019; 9: 3076. | Crossref
- Menegazzo L, Ciciliot S, Poncina N, et al. NETosis is induced by high glucose and associated with type 2 diabetes. Acta Diabetol. 2015; 52: 497‑503. | Crossref
SUPPLEMENTARY MATERIAL
ARTICLE INFORMATION