Lens autofluorescence ratio as a noninvasive marker of peripheral diabetic neuropathy
Key words: diabetic retinopathy, lens autofluorescence


 CC BY-NC-SA 4.0
Lens autofluorescence ratio as a noninvasive marker of peripheral diabetic neuropathy
Introduction: Diabetes and its complications are the significant cause of morbidity and mortality. Advanced glycation end products play a major role in the pathogenesis of diabetes complications.
Objectives: The aim of the study was to investigate the possible use of a biomicroscope (ClearPath DS‑120), which shows the age‑adjusted lens fluorescence ratio (LFR), for the diagnosis of diabetic peripheral neuropathy (DPN).
Patients and methods: A total of 160 patients with type 2 diabetes who underwent an LFR measurement were recruited to this study. DPN was defined as the presence of neuropathic pain or feet sensory loss (or both). Neurothesiometer, monofilament test, and DN4 test results were used for the diagnosis of DPN.
Results: The LFR of 43 patients (27%) was higher than the expected levels. According to the DN4 questionnaire, 35 of 160 patients (21%) had neuropathic pain. Thirty‑seven patients (23%) had higher vibration perception thresholds than expected (>25 V). The monofilament test showed that 42 patients (26%) seemed to be affected by DPN. All of the tests, when considered individually, revealed that patients with higher LFR had more problems related to DPN (P <0.05). High LFR had a sensitivity of 50% and a specificity of 81% in the diagnosis of DPN. Although there was no significant difference in fasting blood glucose levels, we observed that HbA1c levels were higher and diabetes duration was longer in patients with higher LFR (P <0.05).
Conclusions: The measurement of LFR may have clinical utility for a noninvasive detection of DPN.
Introduction
Diabetes and its complications are rapidly becoming the most significant cause of morbidity and mortality worldwide.1 The International Diabetes Federation Diabetes Atlas has estimated that in 2017 there were 451 million people with diabetes worldwide and that number is expected to increase to 693 million by 2045.1Diabetic neuropathy is the most common complication of diabetes mellitus and affects as many as 50% of patients.2,3 Diabetic peripheral neuropathy (DPN) accounts for approximately 75% of diabetic neuropathy cases and is the primary risk factor for diabetic foot ulceration and amputation.4,5
Several different methods can be used to detect DPN, including clinical findings and quantitative methods (eg, nerve conduction studies, validated questionnaires, vibration sense, thermal and pinprick tests).5,6 The conventional electromyographic test assesses only large nerve fibers (diameter ≥5–7 μm) and remains normal in patients with neuropathy that selectively affects the small nerve fibers (diameter <5–7 μm). The involvement of small nerve fibers is revealed by subjective sensory symptoms (mostly painful, including burning, numbness, tingling, paresthesia and dysesthesia, or signs of dysautonomia).7 Apart from these classic diagnostic tests, the use of skin biopsy, a confocal corneal microscope, and sudomotor function evaluation have been reported in the literature.8Since none of the tests are wholly sufficient to diagnose neuropathy for both small and large nerves, there is a need to develop methods for measuring the sources that cause neuropathy development.
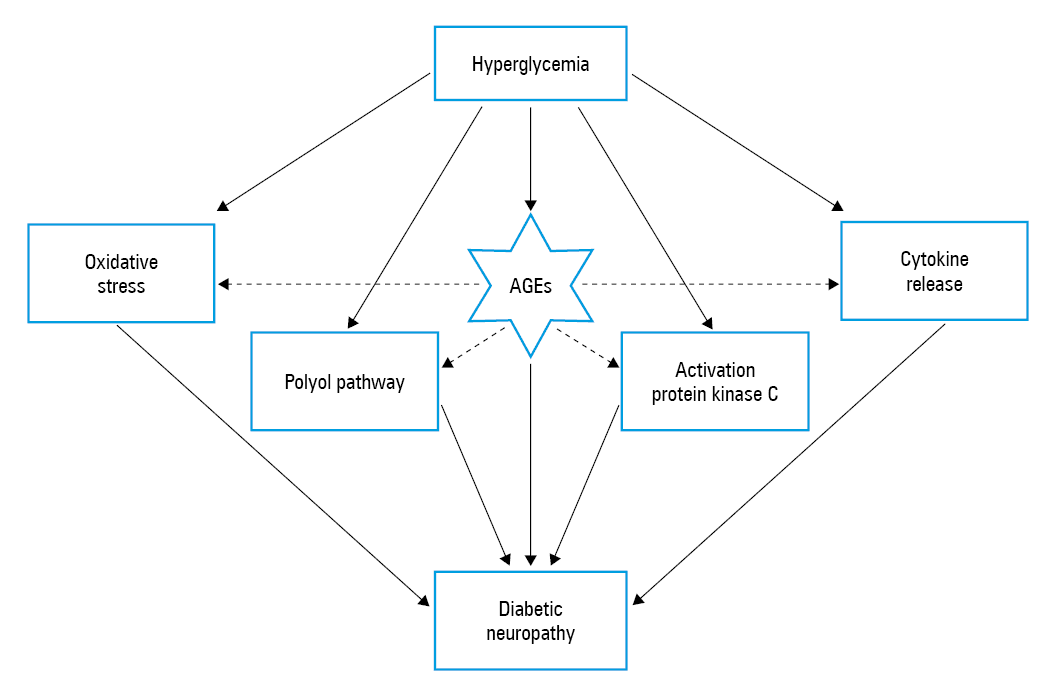
Diabetic neuropathy arises due to long‑standing hyperglycemia, which leads to peripheral nerve injury through the enhanced formation of advanced glycation end products (AGEs), increased flux of the polyol pathway, excessive release of cytokines, activation of protein kinase C, and oxidative stress.9 Since AGEs are associated with all these pathogenic mechanisms, they play a major role in the pathogenesis of diabetic neuropathy (Figure 1).10
AGEs are harmful compounds that are established through nonenzymatic reactions between proteins or lipids with sugars.11 Lens crystallins, nerve myelin, and skin collagen are sites where AGEs accumulate and are irreversibly stored in proteins over a person’s lifetime.12-14 Although lens autofluorescence is increased in patients with high AGE levels, there is no instrument that can evaluate lens autofluorescence and is simultaneously suitable for routine clinical use.15 In this study, we aimed to investigate the potential use of the lens fluorescence ratio (LFR) for diagnosing DPN.
Patients and methods
The study included 160 consecutive patients with type 2 diabetes, who were followed at the outpatient diabetic clinics of Fatih Sultan Mehmet Education and Research Hospital in Istanbul, Turkey. Type 2 diabetes was diagnosed according to American Diabetes Association criteria.16 The inclusion criteria for this study included age between 21 and 70 years and ability to complete the health questionnaire. The exclusion criteria were as follows: any cause of neuropathy other than diabetes mellitus (vitamin or nutritional deficiencies, hypothyroidism, polycythemia, and hepatic failure); previous removal of crystalline lens and replacement with an intraocular lens implant; a fluorescence angiogram within the past 6 months; treatment with photodynamic therapy within the past year; ocular surface (dry eye) disease; and inability to cooperate or understand clinical instructions.
In our study, we used lens fluorescence measurement and standard diabetic neuropathy tests (neuropathic pain diagnostic questionnaire [DN4], neurothesiometer, monofilament test) to assess the possible relationship between the LFR and diabetic neuropathy.
The study was conducted in accordance with the ethical principles of the Declaration of Helsinki and approved by the Ethics Committee of the Fatih Sultan Mehmet Education and Research Hospital. Signed informed consent was obtained from all participants.
Lens fluorescence ratio measurement
Various studies have shown that the intensity of lens autofluorescence increases with age and in the presence of diabetes mellitus.15,17 Since age affects the lens fluorescence measurements, all the devices used for the measurement need to be adjusted to the age of the patient.
The ClearPath DS‑120® lens fluorescence biomicroscope optical system (Freedom Meditech, San Diego, California, United States) consists of a blue (465 nm) LED excitation light with a 430- to 470‑nm band‑pass filter, source and collection focusing optics, a motor‑driven filter wheel with 25% neutral density (scatter), long‑pass (fluorescent emission, 500–1650 nm) filters, and a silicon photomultiplier light detector. Under software control, the volume measurement at the focal spot of the light source and sensor is scanned from just behind the posterior lens capsule, through the lens, and anterior lens capsule to the aqueous humor, and then backward again. The computer software used in this study records both scattered and fluorescent light during the forward and reverse scan, and the results are presented graphically on the computer monitor. The software detects the front and back surfaces of the lens capsule on the graph, estimates the apparent thickness of the lens, and computes the average of the ratio of lens autofluorescence to scattered light in the central portion of the lens.14
Burd et al14 developed a method on the ClearPath DS‑120 that enables the fluorescence biomicroscope to identify patients who have significantly higher fluorescence ratios than expected for their age. The ratios that were above the 95% predicted values were classified as high. In our study, we used this method to classify patients as having high or low LFR.
Assessment of diabetic peripheral neuropathy
In patients with diabetic neuropathy, small or large nerve fibers might be affected individually or together. In our clinical study, we used DN4, vibration perception, and monofilament tests to diagnose DPN.
The DN4 contains 7 items related to neuropathy symptoms (burning, painful cold, tingling, electric shocks, pins and needles, numbness, and itching) and 3 items related to clinical examination (pricking hypoesthesia, touch hypoesthesia, and brushing). A score of 1 is given to each positive item and a score of zero to each negative item. The entire grade is computed as the sum of the 10 items, and a total score of 4 or more out of 10 suggests neuropathic pain.18
Sensory function in peripheral neuropathy was assessed via vibration perception threshold (VPT) testing, using a neurothesiometer (Arnold Horwell, London, United Kingdom) at 10 different points on each of the patient’s legs. The voltage of the neurothesiometer was increased until the patient felt the vibration. According to Young et al,19 patients were considered at risk of foot ulceration if the VPT was 25 V or higher, as this value is associated with an 8‑fold increase in ulcer risk.19
All patients were screened for sensory neuropathy using both 10‑g Semmes–Weinstein monofilaments and biothesiometry. The Semmes–Weinstein monofilament examination was performed according to the recommendations of the International Working Group on the Diabetic Foot using validated 10‑g monofilaments. Three sites (the pulp of the hallux and the plantar aspects of the first and fifth metatarsal heads) were tested on both feet; at each site, the monofilament was applied 3 times in a random order. If the patients felt the pressure, they were asked to identify on which foot they felt the sensation. If the patient did not feel any pressure or if they were wrong about the site of pressure, the answer was accepted as wrong. The peripheral sensation was accepted as impaired if at least 2 of 3 answers were incorrect, even on one of the 3 sites. If the peripheral sensation was considered impaired, then the patient was regarded as being prone to foot ulceration. All the tests were performed in the same environment by an experienced nurse.
Laboratory parameters
Venous blood samples were obtained after overnight fasting. All blood parameters that reflected the glucose and lipid metabolism as well as liver and renal function were collected using standard laboratory methods. Glycated hemoglobin A1c (HbA1c) levels were measured by high‑performance liquid chromatography (Trinity Biotech Premier Hb9210, Bray, Ireland). All the other biochemical tests, except low‑density lipoprotein cholesterol levels, were conducted via the enzymatic method by Abbott Architect C16000 autoanalyzer (Abbott Diagnostics Inc, Park City, Illinois, United States). Low‑density lipoprotein cholesterol levels were estimated using the Friedewald formula if the triglyceride level was lower than 400 mg/dl.
Statistical analysis
All analyses were performed using the statistical package for the social sciences (SPSS) program version 22.0 for Windows. Continuous variables were presented as a mean (SD) or median (interquartile range), whereas categorical and qualitative variables, as numbers (percentages). The 1‑sample Kolmogorov–Smirnov test was used to assess the distribution of the data. Numerical variables in different patients were compared using either the t test or Mann–Whitney test. Correlation analyses were performed using the Pearson or Spearman correlation test, according to their distribution. We also used a linear regression analysis to show a detailed relation of parameters. Categorical variables were analyzed by the χ2 test. Probability values were 2‑tailed, and a P value of less than 0.05 was considered significant
Results
The study included 160 patients with diabetes (98 women and 62 men). The mean (SD) age of patients was 58.39 (8.85) years, and the mean (SD) duration of diabetes was 8.48 (7.71) years. The LFR of 43 patients (27%) was higher (>95% of predicted values) than expected. Our analysis revealed that patients with higher LFRs had higher HbA1c levels and longer diabetes duration (P <0.05) (Table 1). Although HbA1c levels were higher in these patients, there was no difference in fasting blood glucose levels between patients with higher LFRs and those with normal LFRs (P = 0.43).
Parameter | LFR, %(normal range) | High LFR, %(>95% predicted value) | P value |
SI conversion factors: to convert glucose to mmol/l, multiply by 0.0555; total cholesterol and LDL and HDL cholesterol to mmol/l, by 0.0259; and triglycerides to mmol/l, by 0.0113; creatinine to mmol/l, multiply by 0.0884.
Abbreviations: GFR, glomerular filtration rate; HbA1c, hemoglobin A1c; HDL, high‑density lipoprotein; LFR, lens fluorescence ratio; LDL, low‑density lipoprotein | |||
Lens fluorescence ratio, % | 22.34 (4.11) | 32.45 (4.47) | <0.001 |
Age, y | 58.05 (8.84) | 59.29 (8.9) | 0.43 |
Diabetes duration, y | 7.61 (7.41) | 10.79 (8.10) | 0.02 |
Glucose, mg/dl | 151.38 (62.97) | 163.92 (69.32) | 0.29 |
HbA1c, % | 7.44 (1.81) | 8.51 (2.20) | <0.01 |
Creatinine, mg/dl | 0.81 (0.22) | 0.91 (0.41) | 0.08 |
GFR, ml/min/1.73 m2 | 88.59 (15.83) | 86.99 (15.90) | 0.65 |
Urinary protein to creatinine ratio | 0.18 (0.33) | 0.23 (0.30) | 0.53 |
Total cholesterol, mg/dl | 214.07 (45.08) | 210.94 (41.53) | 0.72 |
LDL cholesterol, mg/dl | 132.77 (37.19) | 131.67 (37.77) | 0.88 |
HDL cholesterol, mg/dl | 44.93 (9.62) | 46.4 (14.52) | 0.51 |
Triglycerides, mg/dl | 181.48 (14.39) | 162.51 (93.15) | 0.45 |
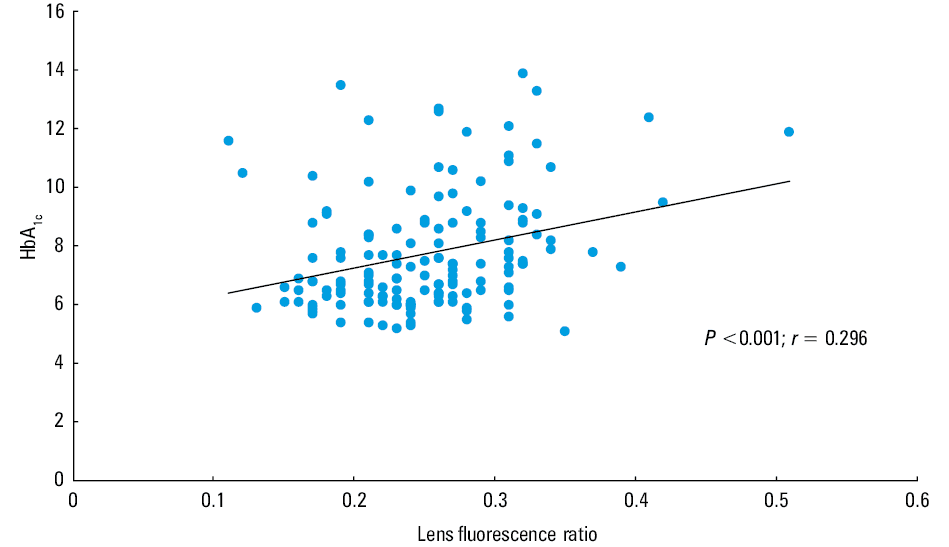
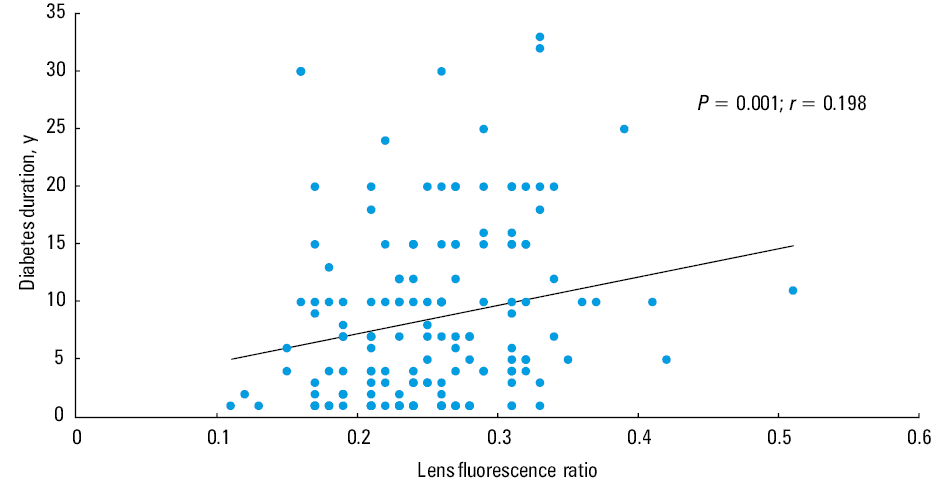
The LFR correlated positively both with HbA1c levels and diabetes duration (P <0.001; r = 0.296 and P = 0.012; r = 0.198) (Figures 2 and 3). A regression equation was found: F (1.146) = 14.034, P <0.001, with an R2 of 0.09. Participant‑predicted LFR was 0.180 + 0.009 × (HbA1c). A minimum regression equation was also found with the LFR and diabetes duration: F (1.158) = 6.476, P = 0.012, with an R2 of 0.04. Participant‑predicted LFR for diabetes duration was 0.238 + 0.002 × (diabetes duration). We did not find any correlation between the LFR and age (P = 0.584; r = 0.044).
The DN4 questionnaire revealed that 35 of 160 patients (21%) had neuropathic pain. Painful cold (P = 0.012), numbness (P = 0.007), touch hypoesthesia (P = 0.02), and pricking hypoesthesia (P <0.001) were most often observed in patients with higher LFR, as compared with those with lower values.
Based on neurothesiometer data, 37 patients (23%) had higher VPTs than expected (>25 V). There was also a correlation between the LFR and maximum VPT levels (P = 0.002; r = 0.242). When we used the monofilament test as a diagnostic tool, 42 patients (26%) seemed to be affected by DPN (Table 2).
Parameter | Low fluorescence ratio | High fluorescence ratio | P value | |
a X2 (1, N = 160) = 16.514, P <0.001
Abbreviations: DPN, diabetic peripheral neuropathy | ||||
DN4 neuropathic pain | No | 100 | 25 | <0.001 |
Yes | 17 | 18 | ||
Thesiometer neuropathy | No | 97 | 26 | <0.01 |
Yes | 20 | 17 | ||
Monofilament test | No | 92 | 26 | 0.02 |
Yes | 25 | 17 | ||
DPN | No | 95 | 21 | <0.001a |
Yes | 22 | 22 | ||
If we evaluated patients who were assessed by any one or more of the 3 tests (DN4 question- naire, neurothesiometer, or monofilament tests) as having diabetic neuropathy, we detected a total of 43 patients (27%) with diabetic neuropathy. Patients with high LFR levels were more often affected by DPN than those with lower levels (P <0.05). High LFR levels had a sensitivity of 50% and a specificity of 81% in the diagnosis of DPN.
Discussion
Peripheral neuropathy is an important complication of diabetes that can lead to foot ulceration and even amputation. Although DPN is the most frequent complication, it is commonly unrecognized and therefore underdiagnosed.6 In a study that included 7832 patients, William et al20 found that, initially, the awareness of doctors about the presence of diabetic neuropathies in their patients was 18%, but after the monofilament test, the rate of diagnosis increased to 37%. In another study, Erbas et al21 reported the prevalence of diabetic neuropathy as 40% after clinical examination, whereas this proportion was 62% with an electromyography‑supported clinical examination; the overall prevalence of neuropathic pain was 14%.
Since AGEs play a major part in the development of diabetes complications, in this work, we proposed to examine the relationship between the LFR and DPN. Although circulating or tissue‑bound AGEs can be evaluated by various methods, the increase in AGEs due to age is a problem in terms of the clinical use of AGEs.22-24 In 1999, Abiko et al25 suggested that the noninvasive measurement of lens autofluorescence might be related to AGE levels in lenses. Studies have shown that lens autofluorescence intensity increases with the age of the patient and is further increased with the presence of diabetes.26 In our study, we used a biomicroscope (ClearPath DS‑120), which shows the age‑adjusted LFR to allow a quick and inexpensive measurement of AGE accumulation.14 Those patients who had higher LFRs than expected also had positive results in all neurologic tests that are currently used to diagnose DPN.
Although DN4 is a clinician‑administered screening tool for neuropathic pain with 7 items related to pain description and abnormal sensation, it is obvious that some of these items also include symptoms that reveal the presence of small fiber neuropathy (pain, including burning, numbness, prickling, paresthesia, and dysesthesia).18,21 In our survey, the neurotic pain ratio was 21%, which was consistent with previous studies.27 We showed that the neuropathic pain scores were higher in the group with high LFRs than the group with normal LFRs. Araszkiewicz et al28 reported an association between small fiber neuropathy and a higher accumulation of skin AGEs. In another study, Rajaobelina et al29 used skin autofluorescence as an indicator of AGE levels and the neurothesiometer with the DN4 questionnaire for the diagnosis of DPN. They detected an obvious relationship between skin autofluorescence and diabetic neuropathy.
For the diagnosis of DPN, we also used the neurothesiometer and monofilament tests, which have been commonly used and are accepted for the grading of large fiber and diabetic neuropathy.30-32 In accordance with the literature, we also found that both the monofilament and neurothesiometer tests reported a higher risk of neuropathy in those groups with high LFRs.29
In this study, we also found significant relationships between the LFR and both HbA1c levels and the duration of diabetes, which is consistent with the literature.33,34 On the other hand, we did not find any relation with age and lens fluorescence. One of the reasons may be that in most studies showing that increased fluorescence intensity is associated with increasing age the study population comprised of healthy volunteers.13,17 Another possibility is that the effect of age on fluorescence intensity may not be observed in the presence of high blood sugar, because high blood sugar prominently affects the fluorescence intensity of the lens.14,33,34
In conclusion, high LFR was found to be related with either small or large nerve fiber damage, or both. Although with the high specifity of the results, age‑adjusted LFR measurements with the ClearPath DS‑120 biomicroscope yield significant outcomes in the diagnosis of neuropathy, the instrument seems to have low sensitivity. The primary issue with the measurement of AGEs and diagnosis of DPN is to determine simple, fast, and cost‑effective methods.8,35 Our results suggest that the LFR assessment with a biomicroscope may not be a gold standard, but with its simple, fast, and high‑specificity measurements, it may be an alternative method for the assessment of DPN.
- Cho NH, Shaw JE, Karuranga S, et al. IDF Diabetes Atlas: Global estimates of diabetes prevalence for 2017 and projections for 2045. Diabetes Res Clin Pract. 2018; 138: 271‑281.
- Zeng L, Alongkronrusmee D, van Rijn RM. An integrated perspective on diabetic, alcoholic, and drug‑induced neuropathy, etiology, and treatment in the US. J Pain Res. 2017; 10: 219‑228.
- Falkowski B, Chudzinski M, Jakubowska E, et al. Association of olfactory function with the intensity of self‑reported physical activity in adults with type 1 diabetes. Pol Arch Intern Med. 2017; 127: 476‑480.
- Pop‑Busui R, Boulton AJ, Feldman EL, et al. Diabetic neuropathy: a position statement by the American Diabetes Association. Diabetes Care. 2017; 40: 136‑154.
- Crawford F, Inkster M, Kleijnen J, et al. Predicting foot ulcers in patients with diabetes: a systematic review and meta‑analysis. QJ Med. 2007; 100: 65‑86.
ARTICLE INFORMATION