Cardiopulmonary exercise test and bioimpedance as prediction tools to predict the outcomes of obesity treatment
Key words: bioelectrical impedance, cardiopulmonary exercise test, obesity, treatment prediction


 CC BY-NC-SA 4.0
Cardiopulmonary exercise test and bioimpedance as prediction tools to predict the outcomes of obesity treatment
Introduction: Obesity impacts the global population. Bioelectrical impedance analysis (BIA) and cardiopulmonary exercise test [CPET]) may help modify the treatment.
Objectives: We aimed to compare BIA and CPET results in obese and lean indivisuals, assess changes in BIA and CPET during obesity treatment, and indentify parameters predicting treatment outcome.
Patients and methods: We enrolled 200 obese patients, of whom 45 underwent a lifestyle modification treatment, and 32 lean individuals (controls). Lifestyle modifications included diet, rehabilitation, education, and behavioral therapy. The diet was based on body composition assessed by BIA and fat metabolism assessed by CPET. The intensity of exercise in the rehabilitation program was based on CPET, mainly peak oxygen uptake (VO2peak), fat metabolism (FAT), and fat heart rate (FAT HR). The protocol duration was 12 weeks.
Results: Obese patients differed from lean controls with regard to VO2peak (P <0.0001), oxygen uptake at anaerobic threshold (P <0.0002), respiratory exchange ratio (P <0.014), oxygen uptake to work rate slope (P <0.0004), FAT (P <0.001), FAT HR (P <0.0008), anaerobic threshold heart rate (P <0.0003), as well as fat mass (P = 0.01), fat‑free mass (P = 0.007), resting metabolic rate (RMR) (P = 0.007), total body water (P = 0.01), and extracellular water (P = 0.004). The treatment resulted in increased RMR (P <0.02) and VO2peak (P <0.002), as well as reduced fat tissue (P <0.006) and resting heart rate (P <0.017). The prediction model based on FAT HR, resting heart rate, and FAT enabled the prediction of treatment outcomes in 92% of patients.
Conclusions: Obese patients had pathological FAT and impaired exercise tolerance. Changes in BIA and CPET prove the metabolic impact of lifestyle modification treatment.
Introduction
The number of patients with obesity is increasing worldwide.1,2 It had tripled between 1975 and 2016, affecting more than 650 million adults (13%) in 2016, and 41 million children under the age of 5 years were overweight or obese.1,2 Obesity decreases the lifespan and is related to multiple coexisting diseases.3-7 Current treatment methods include education, lifestyle modification, dietary treatment, pharmacotherapy, and bariatric surgery.8 Unfortunately, despite widespread prophylactic efforts and public health campaigns, the number of obese patients is increasing dramatically.2 On the other hand, the number of medicines available is limited, and surgical methods are most effective in the treatment of morbid obesity and severe obesity with 1 or more significant comorbid conditions when less invasive methods of weight loss have failed and the patient is at risk for obesity‑associated morbidity and mortality. The classic assessment of the patient’s eligibility for treatment is based on the body mass index (BMI). However, a more detailed insight into the pathophysiology of obesity is becoming more popular nowadays. The Edmonton Obesity Staging System is a new tool that can stratify patients into groups depending on the type of treatment they require (noninvasive methods, bariatric surgery, or palliative treatment).9 We hypothesized that the use of bioelectrical impedance analysis (BIA) and a cardiopulmonary exercise test (CPET) may help improve the therapy, adjust the treatment with diet or exercise in patients treated with lifestyle modification, and also increase the safety of treatment.
The aims of the study were to compare the results of BIA and CPET in obese and lean patients, to analyze changes in BIA and CPET during the treatment of obesity with a lifestyle modification program, and to identify parameters that could be used to develop personalized treatment. However, the overriding aim of the study was to investigate obesity treatment based on BIA, CPET, and lifestyle modification.
Patients and methods
A total of 200 consecutive adult obese patients were invited to the study, of whom 45 individuals decided to participate. All patients gave their informed consent to undergo a lifestyle modification treatment for obesity. Contraindications to the treatment included heart, lung, liver, and kidney deficiency, neoplastic disease, active autoimmune diseases, mental retardation, pregnancy, lactation, drug and alcohol abuse, and lack of compliance.
The size of the study group was assessed based on a pilot study that showed that peak oxygen uptake (VO2peak) results were lower than predicted in 60% of obese patients regardless of age and sex. Additionally, a body mass reduction greater than 5% was found in 60% of participants who completed the treatment. On the other hand, in patients who did not finish the study, such a body mass reduction was not observed.10 Based on the method by Altman et al,11,12 with an assumption that the power of test is 0.9 and a P value is lower than 0.05, the minimal number of patients was assessed as 30. Due to the dropout rate of 30% in the pilot study, a group of 45 patients was included in the study. The study was approved by the Ethical Committee of the Medical University of Gdańsk (Gdańsk, Poland) (NKEB/41/2010) and performed in the years 2011 to 2014.
The study protocol was based on an intense lifestyle modification by a dietary intervention, medical rehabilitation with patient education, and behavioral therapy. The diet treatment was based on the body composition results assessed by BIA, fat metabolism (FAT) assessed by CPET, and the patients’ preferences. The intensity of exercise in rehabilitation was based on the CPET results, mainly VO2peak, FAT, and fat heart rate (FAT HR). The protocol duration was 12 weeks. During the baseline visit in an outpatient ward of the Department of Clinical Nutrition at the Medical University of Gdańsk, patients were consulted by a physician and dietitian, as well as underwent BIA and CPET. In the first phase of the study, which lasted 6 weeks, the patients had 3 dietary consultations and medical rehabilitation 3 times a week in a daily ward of the Department of Rehabilitation Medicine at the Medical University of Gdańsk. Patients were instructed on how to continue the exercise and diet treatments at home. After 6 weeks, a follow‑up medical consultation was performed, and the dietary treatment and exercise were modified according to the initial treatment outcomes. In the second phase, which lasted 6 weeks, patients visited a dietitian 3 times and performed exercise at home according to the protocol. At the final visit, the last medical consultation, BIA and CPET were done. The subsequent treatment was continued in an outpatient clinic of the Department of Clinical Nutrition.
The BIA was done using a MaltronBioScan 920–2 (Maltron International, Rayleigh, Essex, UK). Patients were asked to remove jewellery and to urinate before the examination. They were also asked to refrain from eating for 4 to 5 hours before the test, exercising for 12 hours before the test, and consuming caffeine (tea, coffee, or energy drinks) or alcohol 24 hours before the test. The CPET was performed with a LodeCorival (Lode B.V., Groningen, the Netherlands). Patients had to report about 3 hours after a light meal, in comfortable, loose clothing and sports footwear that allows walking on a treadmill or riding a bicycle. They were asked to avoid a considerable physical effort up to 6 hours before the examination; strong coffee, tea, or other energizing beverages; and cigarette smoking. Moreover, they were instructed to take their regular medications on the day of the test. The data were analyzed using Metasoft 3.9 CortexBiophisik (CortexBiophisik GmbH, Leipzig, Germany). Fat burning was assessed by an indirect calorimetry method and estimated on the basis of measured O2 consumption, CO2 production, and the amount of external work (energy) generated during the incremental stress test on a cycloergometer. The algorithm used for calculations was provided by Cortex GMBH Germany. A SunTech Tango (Sun Tech Medical, Morrisville, North Carolina, United States) was used to monitor blood pressure and a CardioDirect 12 (Spacelabs Healthcare, Snoqualmie, Washington, United States) to analyze electrocardiogram results.
Treatment
The dietary treatment was based on individual diets formulated during the first visit. The daily intake of protein was 15% to 25%; fat, 20% to 40%, including less than 10% of saturated fatty acids; and carbohydrates, 35% to 65%. The energy value was individualized. The hypocaloric balanced diet supplied 1200 to 1500 kcal/d for women and 1500 to 1800 kcal/d for men. If the treatment was ineffective, the low calorie diet was used with the supply of 800 to 1200 kcal/d with a daily intake below 30% of fat and less than 10% of saturated fatty acids. The nutritional habits were discussed during the 6 dietary consultations. The cognitive behavioral therapy was delivered at this step, including a nutritional diary written by the patient. It helped patients to assess the influence of the diet on their emotions and improved their awareness of cognition and nutritional habits.
Medical rehabilitation was performed in 2 steps: 1) in the daily medical rehabilitation ward, and 2) at patients’ homes. The first step included exercise on a cycloergometer and general training. The intensity of the exercise was established based on the CPET result and FAT value. The second step done by the patient at home included a warm‑up (15 minutes) and proper exercises (4 cycles of 3–5‑minute walking, 3 cycles of 3–5‑minute running) interspersed by breathing exercises. The last part consisted of rest and breathing exercises for up to 3 minutes. The whole training lasted 30 minutes. Patients were instructed on how to control their heart rate (HR) and blood pressure.
Statistical analysis
Data were analyzed using Statistica 12.0 (StatSoft, Palo Alto, California, United States) using the Mann–Whitney test, χ2 test, and receiver operating characteristic curve. The prediction model was constructed using the Mann–Whitney test. The results were presented as means (range). The siginficant test result was set at a P value of less than 0.05.
Results
Study participants were selected from a group of 200 naive patients who were able to choose between the standard diet treatment, a lifestyle modification program, and obesity treatment. Lifestyle modification treatment was initiated in 45 patients at a mean age of 45 years (range, 24–65 years), including 31 women (70%) and 14 men (30%). The majority of patients (90%) had previously tried other treatment options. The control group consisted of 32 healthy lean employees of the university. We aimed to compare changes in the results observed during the obesity treatment between patients and healthy controls. Detailed characteristics of the study and control groups are provided in Table 1.
Parameter | Study group | Women | Men |
The results are presented as mean (range) unless otherwise indicated.
Abbreviations: BMI, body mass index | |||
Obese patients | |||
No. (%) of patients | 45 (100) | 31 (70) | 14 (30) |
Age, y | 43 (24–65) | 41.3 (24–65) | 48.9 (35–63) |
Initial BMI, kg/m2 | 37 (30.1–50.9) | 36 (30.1–49.7) | 39.5 (30.3–50.9) |
Initial body mass, kg | 107 (70–167) | 99 (70–128) | 126 (92–167) |
Controls | |||
No. (%) of patients | 32 (100) | 14 (44%) | 18 (56%) |
Age | 30 (20–55) | 32 (20–51) | 29 (21–55) |
BMI, kg/m2 | 22.3 (18.3–24.7) | 22.5 (20–24.7) | 20 (18.3–24.5) |
Body mass, kg | 75 (48–90) | 57 (48–66) | 80 (58–90) |
The severity of nutrition disorders was assessed according to the World Health Organization guidelines2 as obesity grade I (16 patients [36%]), II (20 patients [44%]), III (9 patients [20%]).
The coexisting diseases are described in Supplementary material, Table S1. Participation in the lifestyle modification program did not require treatment modification. The intensity of exercise was corrected in patients with coronary artery disease, hypertension, or asthma.
No coexisting diseases were found in 4 patients (10.5%), while 8 patients (21%) had 1 coexisting disease; 4 patients (10.5%), 2 diseases; 9 patients (25%), 3 diseases; 4 patients (10.5%), 4 diseases; 2 patients (5%), 5 diseases; 4 patients (10.5%), 6 diseases; and 3 patients (8%), 7 diseases. The prevalence of metabolic disturbances (including hypertension, hypercholesterolemia, diabetes, and impaired glucose tolerance) was assessed. None of the diseases were found in 19 patients (42%); 1 disease was observed in 12 patients (27%); 2, in 9 patients (20%); and 3, in 5 patients (11%).
Comparison of bioelectrical impedance analysis and cardiopulmonary exercise test results
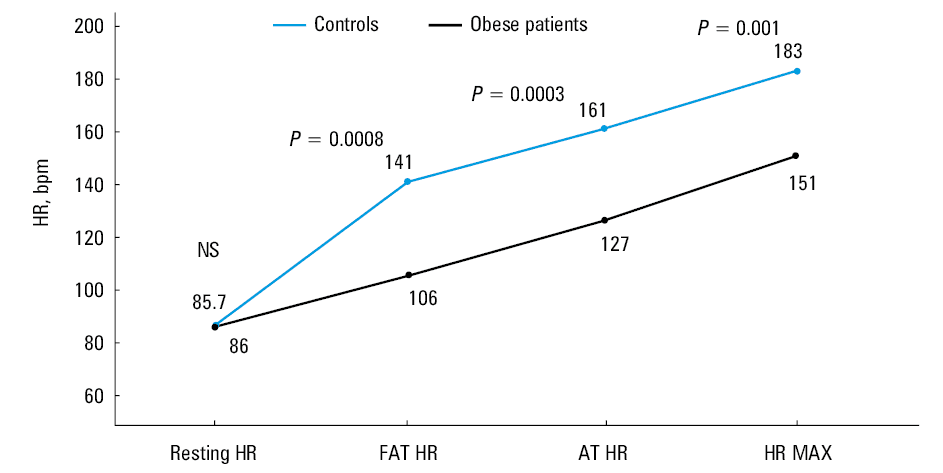
The following CPET results were lower for obese patients in comparison with controls: peak oxygen uptake VO2peak (P <0.0001), oxygen uptake at the anaerobic threshold (VO2AT) (P <0.0002), respiratory exchange ratio (RER) (P <0.014), oxygen uptake to work rate (VO2/WR) slope (P <0.0004), FAT (P <0.001), FAT HR (P <0.0008), and anaerobic threshold heart rate (AT HR) (P <0.0003). The results are shown in Figure 1 and Supplementary material, Table S2.
The results of BIA showed differences in the body composition between lean and obese patients in fat mass (P = 0.01), fat‑free mass (P = 0.007), resting metabolic rate (RMR) (P = 0.007), total body water (TBW) (P = 0.01), and extracellular water (P = 0.004) (Supplementary material, Table S3). The results may be in part casused by a higher percentage of women among obese patients.
The results of BIA and CPET were compared between obese men and women (Supplementary material, Tables S4 and S5). The results suggest typical sex differences related to physiologically higher muscle mass in men and fat tissue in women. The CPET showed higher HR and FAT HR in women, and VO2peak, VO2/WR slope, VO2AT, the rate of elimination of carbon dioxide (VCO2), maximal ventilation, and ventilation in anaerobic threshold in men.
Results of obesity treatment
A total of 45 patients underwent treatment, of whom 33 (73%) finished the protocol. There were 12 dropouts (27%), who stopped the treatment mainly due to lack of time for medical rehabilitation. A decrease in body mass of 5% or higher was achieved in 23 patients (70%) who completed the study. Among them, 13 (43%) achieved a weight loss greater than 10%. Treatment outcomes of patients with different body mass are presented in Table 2. The results were not related to sex, and a moderate correlation with age was found (r = –0.3; P <0.05).
Body mass reduction, kg | Body mass reduction, % | |
The results are presented as mean (range). | ||
Men | 11.3 (–5 to 28) | 9.2 (–4 to 23.7) |
Women | 7.6 (–5 to 18) | 7.5 (–5 to 16.5) |
Class I obesity | 5.6 (–5 to 11.5) | 6.2 (–5 to 13) |
Class II obesity | 11.3 (3.7–28) | 10.8 (3.6–23.7) |
Class III obesity | 9.7 (0–18.7) | 7.5 (0–12.7) |
Treatment outcomes were better in patients with class II or III obesity than in those with class I (mean [SD] 11.13 [6.7] kg vs 4.8 kg [5.7]; P <0.02). The differences in BIA and CPET results in patients with different classes of obesity are shown in Supplementary material, Tables S6 and S7.
At the end of the 12‑week treatment, we compared the results of BIA and CPET (Supplementary material, Tables S8 and S9) observed before and after the treatment in the group of 33 patients who completed the treatment. An increase in RMR (P <0.02) and a decrease in fat tissue (P <0.006) were found. There was also an increase in VO2peak (P <0.002) and a decrease in resting HR (P <0.017).
The results of BIA and CPET done before the treatment were assessed with regards to the effect of therapy. Patients who achieved a reduction in body mass of 5% or higher were younger in comparison with patients who did not achieve this result (mean [SD] age, 41.1 [7.9] years vs 52.7 [9.5] years; P = 0.001). A similar difference was found when analyzing the 10% reduction of body mass. Patients who lost 10% of their weight were younger in comparison with those who did not (mean [SD] age, 40.2 [8.7] vs 47.6 [9.6]; P = 0.03). No differences related to any coexisting diseases or metabolic disturbances were observed.
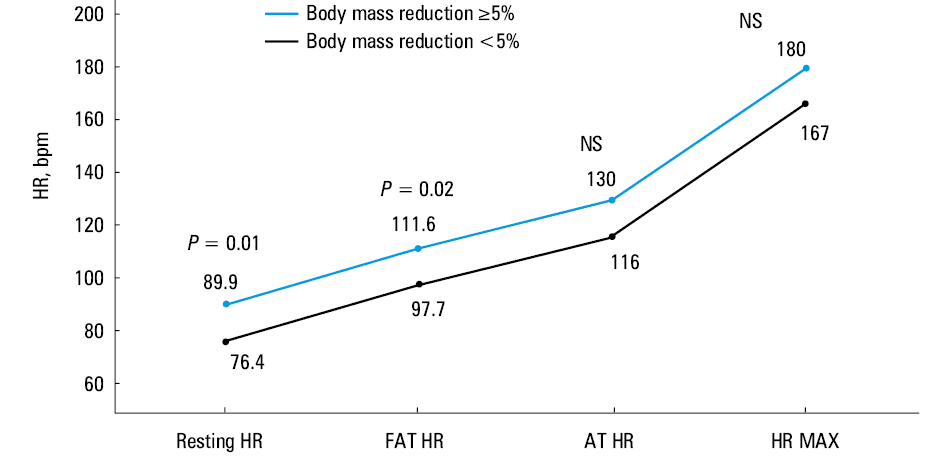
The results of BIA and CPET done before the treatment were compared in patients who achieved a weight reduction of 5% or higher and of more than 10% (Tables 3 and 4). Patients who did not benefit from the treatment presented maximal FAT at a lower FAT HR (P = 0.02) and the anaerobic metabolism of fat was initiated at a lower HR (AT HR, P = 0.005) (Figure 2), which seems consistent considering that FAT HR is always followed by AT HR.
Parameter | Body mass reduction ≥5% | Body mass reduction <5% | P value |
Data are presented as mean (SD). Differences in HRmax are the consequence of age differences in both groups.
Abbreviations: FAT HR, fat heart rate; HRmax, maximal heart rate; TBW, total body water | |||
Bioimpedance | |||
FAT, kg | 48.6 (8.8) | 40.1 (11.2) | 0.03 |
TBW, % | 42.9 (3) | 46.8 (5.8) | 0.04 |
Body vol, l | 105.2 (16.2) | 81.8 (34.7) | 0.03 |
Cardiopulmonary exercise test | |||
HR at rest | 89.9 (12.7) | 76.4 (7.1) | 0.01 |
HRmax | 180 (7.4) | 167.2 (10.2) | 0.002 |
FAT HR | 111.6 (14.1) | 97.7 (10.5) | 0.02 |
Parameter | Body mass reduction ≥10% | Body mass reduction <10% | P value |
Data are presented as mean (SD).
Abbreviations: AT HR, anaerobic threshold heart rate; others, see Table 3 | |||
Bioimpedance | |||
TBW, % | 41.8 (2.4) | 45.4 (4.7) | 0.04 |
Cardiopulmonary exercise test | |||
HR at rest | 92.6 (15) | 82 (9.9) | 0.04 |
FAT HR | 117.4 (11.5) | 101 (13) | 0.006 |
AT HR | 138.8 (15.4) | 118 (15.7) | 0.005 |
The next step of the analysis focused on the most promising parameters described above: FAT, TBW, and body volume measured by BIA, as well as resting HR, FAT HR, and AT HR measured by CPET at the baseline visit. A receiver operating characteristic curve analysis was done to assess the sensitivity and specificity in the prediction of achieving the 5% or higher body mass reduction (Supplementary material, Table S10). The analyses which showed the highest sensitivity and specificity were FAT HR (with a cutoff value above 130 bpm) and resting HR (cutoff above 103 bpm). Both parameters had the area under the curve of 0.80. We also analyzed the results of treatment in patients who achieved a 10% body mass reduction (Supplementary material, Figure S1, Table S11). As in the analysis of the group who achieved a body mass reduction of 10% or higher, the optimal results were achieved in patients with a cutoff level for FAT HR of 121 bpm (area under the curve >0.80).
The prevalence of coexisting diseases indicted that coronary artery disease and hypercholesterolemia were more prevalent in patients who did not achieve the body mass reduction of 5% or higher (Supplementary material, Table S12).
Based on the results of the previous analyses, age, and coexisting diseases, the naive Bayes prediction model was developed. The best results were achieved in the model based on patient age, FAT HR, resting HR, and FAT. The described model enabled the correct prediction of the treatment results in 92% of patients (Table 5).
Components of the prediction model | Accuracy, % | Results predicting the lack of treatment efficacy in patients who achieved the treatment outcome | Results predicting treatment efficacy in patients who did not achieve the treatment outcome |
Age, FAT HR, resting HR, FAT, kg | 92 | 1 | 1 |
Age, FAT HR, resting HR, FAT, kg, TBW, %, AT HR | 88 | 1 | 2 |
Age, FAT, kg | 88 | 0 | 4 |
Age, FAT HR, resting HR | 83 | 2 | 2 |
FAT HR, resting HR, FAT, kg | 83 | 3 | 1 |
We also assessed the likelihood of achieving a body mass reduction of 5% or higher or of more than 10%, depending on the initial resting HR, FAT HR, and AT HR (Supplementary material, Figure S2). Patients with a resting HR above 81 bpm showed a greater probability of a body mass reduction of 5% or higher (odds ratio [OR], 19.5; 95% CI, 1.5–245; P = 0.003), with a similar result observed for a FAT HR above 103 bpm (OR, 19.5; 95% CI, 1.5–245; P = 0.003). Additionally, the probability of a body mass reduction of more than 10% was higher for a FAT HR above 103 bpm (OR, 12; 95% CI, 1.02–139; P = 0.01).
Discussion
Noninvasive obesity treatment using lifestyle modification including diet, medical rehabilitation, behavioral therapy as assessed by CPET and BIA can result in a body mass reduction of 5% or higher in 70% of patients, and a reduction of 10% in 43% of patients. Moreover, the treatment outcome can be predicted in 92% of cases using a prediction model based on age, the results of CPET such as FAT HR and resting HR, as well as fat tissue measured by BIA.
The extent of the obesity pandemic requires the development of effective methods that can be used across large groups of patients. The body mass reduction and percentage of dropouts reported in our study are similar to the results of other studies, including those by Goodpaster et al,13 Christiansen et al,14 Share et al,15,16 and, finally, a large multicenter Look AHEAD study (Action For Health in Diabetes).17
Bioimpedance
The results of BIA indicate a higher RMR, a higher fat tissue mass, a lower fat‑free mass, and a higher percentage of water, especially extracellular water, in obese patients before treatment in comparison with lean controls. The treatment resulted in an increase in RMR and a decrease in fat tissue. No change in fat‑free mass or extracellular water was observed, considering that the analysis of body composition is difficult in obese patients.18,19 This may be the reason why Diabetes Prevention Program,20 TRAMOMTANA,21 and a study by Share et al15 presented limited data on BIA results. The Look AHEAD trial presented the results of dual‑energy X‑ray absorptiometry evaluated in 1019 patients at baseline, 6 months, and at 1, 4, and 8 years. Lifestyle modification resulted in a decrease in fat tissue and an increase of fat‑free mass in the first year of therapy. Treatment with diet and medical rehabilitation prevents a reduction in fat‑free mass, especially cell mass and muscle mass (80% of the fat‑free mass).6 Muscle mass decreases with age21,22; however, the effect is more rapid in obese patients23 and can be prevented by medical rehabilitation.6
The surprising result of the study is a higher RMR in obese people. It may be related to the higher body mass and metabolically active tissues, which require energy supply at rest. The result of RER did not differ in patients who achieved body mass reduction. Data from similar studies on obesity treatment support this finding.24,25 Interestingly, we observed the increase of RMR at the end of the study. The RMR is related to the energy consumed with food and fat‑free mass.26 The increase of fat‑free mass increases RMR and consumed energy. The fat tissue is responsible for the opposite mechanism caused by adiponectin, which decreases appetite as well as insulin and leptin resistance.26 This may explain the differences in body composition found in the study. The fat tissue decreased, while RMR increased. It could be caused by the diminished effect of fat tissue and intense physical training. The TBW was higher in patients who did not achieve body mass reduction. A higher TBW was also observed in obese patients, which could result from heart insufficiency, caused by obesity in the form of concentric hypertrophy.27,28 The results of the Framingham study proved that a rise of BMI of 1 kg/m2 increases the risk of heart insufficiency, which decreases the effectiveness of treatment.28,29 However, patients with more severe class II and III obesity, who were more motivated to participate in the study, had been treated ineffectively in the past.
Cardiopulmonary exercise testing
The comparison of obese patients and controls showed significant differences in maximal oxygen uptake measured as a whole and calculated per kilogram. Additionally, obese patients showed a lower anaerobic threshold, lower RER, maximal HR, and breath frequency. Significant differences in FAT and HR with maximal FAT were also observed. Additionally, their maximal breath frequency per minute was lower, probably due to the impairment of the chest movement caused by obesity. Obese patients were able to exchange 2.3 l of air per minute, while controls exchanged 3.3 l. Additionally, the results of the VO2/WR slope were lower in obese patients, which may indicate an impaired capability of the muscles to perform aerobic effort.30,31 The lower VCO2 levels in obese patients may be caused by the lower amount of fat metabolized during exercise and impaired anaerobic metabolism during exercise.30,31 These results prove the significant negative effect of obesity on all systems analyzed in CPET.
The sex differences found in our study (VO2peak, VO2/WR slope, FAT HR, ventilation, ventilation in anaerobic threshold, normal maximal ventilation) were typical and described before in all age groups.32,33
We also identified the parameter that did not differ in obese patients, namely, the VO2/HR slope, which proves proper heart metabolism.31,34 No differences in blood pressure, maximal HR, breath frequency, or VE/VCO2 slope, which proves effective CO2 elimination, were seen. Furthermore, it indicates that lifestyle modification, including medical rehabilitation, is safe in obese patients.
A comparison of the results, which significantly changed during the treatment, proves increased oxygen consumption related to increased aerobic muscle effort.31 The lower resting HR may be caused by the adaptation of patients to physical exercise. The results of Share et al15 were similar: the increase of VO2peak and the lower resting HR. Data from the Look AHEAD study showed a gradual impairment of the maximal exercise achieved by the patient, measured in metabolic equivalent of task (1 MET = 3.5 ml/min/kg of O2 consumption), which correlates with obesity.17,35 Additionally, obese patients present fear of exercise related to the lack of self‑assessment of exercise which is safe. The common error is related to short and intense exercise leading to tiredness. Controlled medical rehabilitation performed in our study provided the necessary education and ability for objective self‑assessment.
The valuable part of CPET is the ability to assess the amount of metabolized fat in g/h, and HR at which the FAT is optimal. Both values were lower in obese patients. It may be related to the impaired function of the muscles and the ability to perform exercise.36 Lower AT HR values lead to anaerobic, less effective FAT.25,31,33 The use of CPET in our patients enabled the modification of exercise to optimal FAT HR related to better FAT.30,31 The value of maximal VCO2 elimination was shown to be lower in obese patients, which is caused by impaired oxygen debt during exercise.30,31 The difference in FAT in obese people is related to the phase of exercise when it is maximal.33,37 In our study, FAT HR in obese patients was 106.96, while in lean patients, it was 141.2. The literature data show that in obese people, the optimal FAT is related to an exercise intensity below 45% of VO2max, which is approximately 57% of HRmax, while in normal‑weight patients, it equals 45% VO2max, which correlates to 61% of HRmax.33 Additionally, we did not observe a difference in these results related to body mass reduction. This issue needs further studies as the literature data are conflicting, showing an increase, no change, and a decrease of FAT.24 It may be related to the method of treatment. Diet alone may decrease the metabolism while medical rehabilitation may improve it, or at least reverse this trend.25 The data of optimal HR for FAT is useful for patients and may be monitored in daily activity using simple pulsometers.24 The analysis of the effectiveness of treatment according to the results of FAT enabled the identification of patients who may benefit from lifestyle modification. These patients were 10 years younger; secondly, their initial results of FAT HR were similar to those in controls. Last but not least, a higher AT HR indicated better physical fitness.
We also performed a gene expression study,38 which compared the whole genome expression in obese patients and controls regarding CPET. The differences observed indicated abnormalities in fat oxidation and maximal oxygen uptake. The genes with major differences in expression were CLEC12A, HLADRB1, HLADRB4, HLA‑A29.1, IFIT1, and LOC100133662. Interestingly, the IFIT1 gene expression was different in obese patients with asthma.39
Prediction of treatment effectiveness
The results of our study prove that it is possible to predict the results of obesity treatment. The crucial values are patient age (optimal <45 years), and resting HR (>81 bpm). The results of CPET enable finding the HR with optimal FAT during exercise (optimal >103). The BIA measures fat tissue, which if above 36 kg, predicts a good treatment outcome. The analysis based on the above factors enables the proper prediction of the result in 92% of patients.
Current studies indicate several factors that should be considered, such as physical activity, compliance, and time of treatment.14,15 A lower initial BMI predicts the worst treatment outcome,15 which was confirmed in our group. The results of the Look AHEAD study indicate that optimal assessment of the treatment should be done after 2 months with initial assessment after 6 weeks.17,40,41 Treatment modification may be based on additional patient visits or phone calls, which increases the success rate by 8%.42-44 The results of BIA indicate the muscle tissue as the important factor responsible for the treatment outcome.6 The age‑dependent decrease of muscle tissue may be increased by a restrictive diet6,37; however, it can be prevented by additional medical rehabilitation.6,37 An interesting factor described recently is FAT HR. It differs in obese and normal weight teenagers33 and women.24 Patients with low FAT HR may benefit from exercise of a long duration rather than more intense exercise.33 More intense training leads to anaerobic FAT and the ineffectiveness of treatment.33
The results of our study provide the doctors and patients with a new tool in the treatment of obesity. The combination of BIA and CPET in addition to simple clinical parameters may predict the outcome of obesity treatment. It may also modify the diet and medical rehabilitation in obesity.
We are aware of the limitations of our study. The results are promising but should be validated in a study on a larger group of patients and a longer follow‑up. The results of the treatment could be compared with matched obese controls and bariatric patients. The phase of diet and exercise treatment at home could be monitored using more objective methods than a nutritional diary.
Conclusions
The differences found in obese patients in the comparison of the BIA results such as fat mass and fat‑free mass, as well as CPET results such as VO2peak, VO2AT, RER, VO2/WR, FAT, FAT HR, and AT HR, may be related to pathological FAT and impaired exercise tolerance.
The significant improvement of BIA and CPET results (an increase of RMR, VO2peak, and decrease of fat tissue and resting HR) found in patients who reduced their body mass proves that a combination of diet, medical rehabilitation, and behavioral therapy have a positive metabolic impact on the cardiopulmonary system and muscles.
The results led to the development of the prediction model that can predict the outcome of obesity treatment based on lifestyle modification in 92% of patients.
- Ng M, Fleming T, Robinson M, et al. Global, regional, and national prevalence of overweight and obesity in children and adults during 1980‑2013: a systematic analysis for the Global Burden of Disease Study 2013. Lancet. 2014; 384: 766‑781. | Crossref
- Obesity. World Health Organization website. http://www.who.int/topics/obesity/en/. Accessed September 1, 2018.
- Lim S, Vos T, Flaxman A, et al. A comparative risk assessment of burden of disease and injury attributable to 67 risk factors and risk factor clusters in 21 regions, 1990‑2010: a systematic analysis for the Global Burden of Disease Study 2010. Lancet. 2012; 9859: 2224‑2260. | Crossref
- Lu Y, Hajifathalian K, Ezzati M, et al. Global Burden of Metabolic Risk Factors for Chronic Diseases Collaboration (BMI Mediated Effects), Metabolic mediators of the effects of body‑mass index, overweight, and obesity on coronary heart disease and stroke: a pooled analysis of 97 prospective cohorts with 1·8 million participants. Lancet. 2014; 9921: 970‑983.
- Inouye M, Silander K, Hamalainen E, et al. An immune response network associated with blood lipid levels. PLoS Genet. 2010; 6: 9. | Crossref
SUPPLEMENTARY MATERIAL
ARTICLE INFORMATION