Levels of tissue factor pathway inhibitor in patients with inflammatory bowel disease
Key words: Crohn disease, endothelial dysfunction, tissue factor inhibitor, ulcerative colitis, von Willebrand factor


 CC BY-NC-SA 4.0
Levels of tissue factor pathway inhibitor in patients with inflammatory bowel disease
Introduction: Endothelial dysfunction has been reported to be involved in the pathogenesis of inflammatory bowel disease (IBD) and concomitant thromboembolic complications. Inflammation stimulates the expression of tissue factor and tissue factor pathway inhibitor (TFPI) by endothelial cells.
Objectives: This study assessed the relationship between TFPI levels and disease activity in patients with IBD.
Patients and methods: A total of 50 consecutive adult patients with ulcerative colitis (UC), 50 patients with Crohn disease (CD), and 50 healthy controls were enrolled to the study. Plasma levels of total TFPI, free TFPI, and von Willebrand factor were measured. Associations among these levels, disease activity, and inflammatory marker levels were assessed.
Results: Total TFPI levels were higher in patients with IBD (median, 68.5 [IQR, 60.2–80.1] ng/ml) than in controls (median, 61.1 ng/ml [IQR, 54.3–74.2]; P = 0.01). Free TFPI levels were higher in patients with active UC (median, 12.8 ng/ml [IQR, 11.1–15.4]), inactive UC (median, 9.9 ng/ml [IQR, 7.3–11.5]), active CD (median, 11.7 [IQR, 9.7–14.4] ng/ml), and inactive CD (median, 9.7 ng/ml [IQR, 8.6–11.6]) than in controls (median, 5.5 ng/ml [IQR, 4.3–7.2]; P <0.001). In the CD and UC groups, free TFPI levels correlated with the levels of inflammatory markers and disease activity. The von Willebrand factor level was higher in patients with UC (median, 143.4 IU/dl [IQR, 115.5–170.4]) and those with CD (median, 151.8 IU/dl [IQR, 112.8–189.4]) than in controls (85.1 IU/dl [IQR, 77.1–101.5]; P <0.001 for both comparisons).
Conclusions: The anticoagulant TFPI pathway is activated during remissions and flares in patients with IBD. The free TFPI level correlates with biochemical markers of inflammation and disease activity.
Introduction
The etiologies of inflammatory bowel diseases (IBDs) and associated thromboembolic complications remain poorly understood.1-4 The possible involvement of endothelial dysfunction has been suggested.5,6 Endothelial function is activated in numerous inflammatory diseases associated with structural and functional changes of the vascular endothelium.6,7 This endothelium is the principal effector of the inflammatory response, and it activates the coagulation cascade.8 The activated endothelium releases significant procoagulant and anticoagulant agents, including von Willebrand factor (vWF) and tissue factor pathway inhibitor (TFPI).9 The following anticoagulation mechanisms control blood clotting: the heparin‑antithrombin pathway, protein C anticoagulant pathway, and TFPI pathway.10 A recent cell‑based model suggested that the tissue factor (TF) extrinsic pathway acts as the principal regulator of coagulation.11 Physiologically, TF is not expressed, or is only minimally expressed, by endothelial cells. The situation changes when an inflammatory condition associated with the production of various cytokines and inflammatory mediators stimulates TF expression. TFPI is synthesized by endothelial cells.12 Here, we measured total and free TFPI levels in patients with IBD to explore whether such levels reflected disease activity or the development of clinical complications.
Patients and methods
A total of 100 patients with IBD aged 18 to 75 years were prospectively enrolled to the study. The study population included 50 consecutive patients with Crohn disease (CD; mean [SD] age, 34.6 [10.9] years; 22 men) and 50 consecutive patients with ulcerative colitis (UC; mean [SD] age, 37.6 [11.2] years; 26 men). Patients were recruited from the Outpatient Clinic of the Gastroenterology and Hepatology Division of the University Hospital in Krakow, from October 2010 to December 2011. The diagnosis of IBD was based on clinical, radiological, endoscopic, and histopathological criteria.13 Disease activity was assessed using the Crohn’s Disease Activity Index (CDAI) in patients with CD and the Disease Activity Index (DAI) in patients with UC.14,15 Complications were defined as abscesses, stenosis‑triggering postobstructive symptoms, and fistulas. Based on the 2 scores, the study population was divided into subgroups of patients with inactive CD (CDAI score <150), active CD (CDAI score ≥150), inactive UC (DAI score <4), and active UC (DAI score ≥4).
The exclusion criteria were pregnancy, any concomitant inflammatory or hematological disorder, any concomitant severe disease or malignancy, any history of a thromboembolic event, and any history of corticosteroid use in the previous 3 months.
The control group consisted of 50 healthy volunteers (mean [SD] age, 36.7 [12.1] years; 27 men). The study was performed in accordance with all relevant ethical principles of the Helsinki Declaration. Informed consent was obtained from all participants. The protocol was approved by the Bioethics Committee of the Jagiellonian University of Krakow, Poland (KBET/161/B/2010).
We collected data on patient history, demographic characteristics, clinical features, concomitant diseases, current treatments, location of IBD inflammatory changes, and body mass index. Blood samples were collected after an overnight fast, and the following laboratory parameters were determined on the same day: hematocrit, white blood cell count, platelet (PLT) count, C‑reactive protein (CRP) level, activated partial thromboplastin time, prothrombin time, and fibrinogen level. C‑reactive protein was assayed using a Modular P analyzer (Roche Diagnostics, Mannheim, Germany). Complete blood counts were performed using a Sysmex XE‑2100 automated analyzer (Sysmex, Kobe, Japan). The fibrinogen level, activated partial thromboplastin time, and prothrombin time were measured using a Behring Coagulation System (Dade Behring, Marburg, Germany). The levels of vWF were measured using a latex immunoassay on a STAR device (Diagnostica Stago, Asnieres, France) with a detection limit of 2 IU/dl. The levels of total and free TFPI were measured using a latex immunoassay on a STAR device (Diagnostica Stago).
Statistical analysis
All statistical analyses were performed with the Statistica software 12.0 (StatSoft Inc., Tulsa, Oklahoma, United States). Categorical variables were expressed as percentages, normally distributed variables as means with SD, and continuous variables that were not normally distributed, as medians with interquartile ranges (IQRs). The Shapiro–Wilk test was used to assess the normality of the data distribution. The analysis of variance or Kruskal–Wallis test was used to compare continuous variables. Categorical variables were analysed using the χ2 test. The relationships between clinical data, IBD activity, and biochemical parameters were assessed using the Spearman rank correlation coefficient. P values of less than 0.05 were considered significant.
Results
Patient characteristics
The demographic, clinical, and laboratory data are summarized in Table 1. Patients with UC received mesalamine (2–4 g/d); 8 patients were on maintenance therapy with thiopurines. All patients with CD were on maintenance thiopurine therapy, and those with inflammatory lesions of the large intestine received mesalamine (2–4 g/d). No patient had undergone surgery to treat IBD. The mean (SD) DAI score of patients with inactive UC was 1.32 (1.2) points, and that of patients with active disease was 7.64 (2.0) points (P <0.001). Most patients (61%) presented moderate disease activity, 1 showed severe activity, and the remaining 36% had mild UC. The mean (SD) CDAI score of patients with inactive CD was 73.9 (39) points, and that of patients with active disease was 291.6 (85.7) points (P <0.001). Most patients (60%) showed moderate disease activity, 1 had severe exacerbation, and the remaining 33% had mild CD. Higher levels of inflammatory markers (CRP and fibrinogen levels, and the PLT count) were reported in patients with active disease as compared with those with inactive disease and with controls. In the CD group, 4 patients had hypertension; 2, hypercholesterolemia; 2, gastroesophageal reflux disease; and 2 women had hypothyroidism. In the UC group, 6 patients had diagnosed hypertension; 3, hypercholesterolemia; 4, gastroesophageal reflux disease; and 2 hypothyroidism. These patients were on maintenance therapy with antihypertensive drugs, statins, proton pump inhibitors, and levothyroxine substitution, respectively.
Parameter | UC (n = 50) | CD (n = 50) | Control group (n = 50) | P value | Pairwise comparison | |||
UC vs CG | CD vs CG | UC vs CD | ||||||
a χ2 test; b Analysis of variance; c Kruskal–Wallis test; d Mann–Whitney test
Abbreviations: BMI, body mass index; CD, Crohn disease; CG, control group; CRP, C‑reactive protein; IQR, interquartile range; NA, not available; TFPI, tissue factor pathway inhibitor; UC, ulcerative colitis; vWF:Ag, von Willebrand factor antigen; WBC, white blood cells | ||||||||
Men, n (%) | 26 (52) | 22 (44) | 25 (50) | 0.71a | – | – | – | |
Age, y, mean (SD) | 37.6 (11.2) | 34.6 (10.9) | 36.7 (12.1) | 0.32b | – | – | – | |
BMI, kg/m2, mean (SD) | 23.1 (3.8) | 21.9 (4.1) | 24.0 (4.8) | 0.24b | – | – | – | |
Smoking, n (%) | 11 (22) | 9 (18) | 13 (26) | 0.63a | – | – | – | |
Disease duration, y, median (IQR) | 5.5 (3.0–8.0) | 5.0 (3.0–8.0) | – | 0.36d | – | – | – | |
Disease remission, n (%) | 22 (44) | 20 (40) | NA | 0.84a | – | – | – | |
WBC, × 103/μl, median (IQR) | 6.9 (5.6–9.5) | 7.2 (6.0–8.5) | 5.9 (4.8–7.1) | 0.004c | 0.005 | 0.002 | 0.97 | |
Platelets, × 103/μl, mean (SD) | 307 (95.0) | 286 (78.5) | 249 (47.0) | <0.001b | <0.001 | 0.045 | 0.36 | |
Fibrinogen, g/l, median (IQR) | 3.0 (1.8–4.7) | 4.0 (2.1–5.2) | 2.5 (2.2–2.9) | 0.006c | 0.26 | 0.01 | 0.65 | |
CRP, mg/l, median (IQR) | 7.2 (3.9–25.4) | 24.1 (4.7–51.3) | 2.4 (1.4–3.0) | <0.001c | <0.001 | <0.001 | 0.61 | |
TFPI, ng/ml, median (IQR) | 68.9 (61.2–81.4) | 67.9 (59.6–79.6) | 61.1(54.3–74.2) | 0.12c | ||||
Free TFPI, ng/ml, median (IQR) | 11.4 (8.3–13.7) | 10.4 (9.3–13.7) | 5.5 (4.3–7.2) | <0.001c | <0.001 | <0.001 | 0.98 | |
vWF:Ag, IU/dl, median (IQR) | 143.4 (115.5–170.4) | 151.8 (112.8–189.4) | 85.1 (77.1–101.5) | <0.001c | <0.001 | <0.001 | 0.99 | |
There were no differences in total TFPI, free TFPI, or vWF levels according to sex, age, disease duration, or smoking status.
Levels of total and free tissue factor pathway inhibitor
The median total TFPI level was higher in patients than in controls (P = 0.01). Total TFPI levels did not differ between patients with UC and those with CD. The median free TFPI level was significantly higher in patients with IBD than in controls (Table 1). The TFPI level differed between patients with active and inactive IBD (median [IQR], 12.43 ng/ml [9.72–14.8] and 9.8 ng/ml [8.2–11.5], respectively; P <0.001). Free TFPI levels were higher in patients with active and inactive UC and CD than in controls (Tables 2 and 3).
Parameter | Inactive UC (n = 22) | Active UC (n = 28) | Control group (n = 50) | P value | Pairwise comparison | ||
Inactive UC vs controls | Active UC vs controls | Inactive vs active UC | |||||
Data are presented as median (IQR).
a Kruskal–Wallis test
Abbreviations: see Table 1 | |||||||
TFPI, ng/ml | 67.6 (61.5–81.4) | 71.2 (59.4–81.9) | 61.1 (54.4–4.2) | 0.08 | – | – | – |
Free TFPI, ng/ml, | 9.9 (7.3–11.5) | 12.8 (11.1–15.4) | 5.6 (4.3–7.3) | <0.001a | <0.001 | <0.001 | 0.12 |
vWF:Ag, IU/dl | 134.9 (97.4–166.5) | 150 (121.1–184.8) | 85.1 (77.2–101.5) | <0.001a | <0.001 | <0.001 | 0.58 |
Parameter | Inactive CD (n = 20) | Active CD (n = 30) | Control group (n = 50) | P value | Pairwise comparison | ||
Inactive CD vs controls | Active CD vs controls | Inactive vs active CD | |||||
Data are presented as median (IQR).
a Kruskal–Wallis test
Abbreviations: see table 1 | |||||||
TFPI, ng/ml | 66.5 (50.6–71.7) | 71.3 (60.2–83.1) | 61.1 (54.4–74.2) | 0.06a | – | – | – |
Free TFPI, ng/ml | 9.7 (8.6–11.6) | 11.7 (9.7–14.4) | 5.6 (4.3–7.3) | <0.001a | <0.001 | <0.001 | 0.49 |
vWF:Ag, IU/dl | 123.6 (104.3–163.2) | 172.3 (120.9–200.5) | 85.1 (77.2–101.5) | <0.001a | <0.001 | <0.001 | 0.63 |
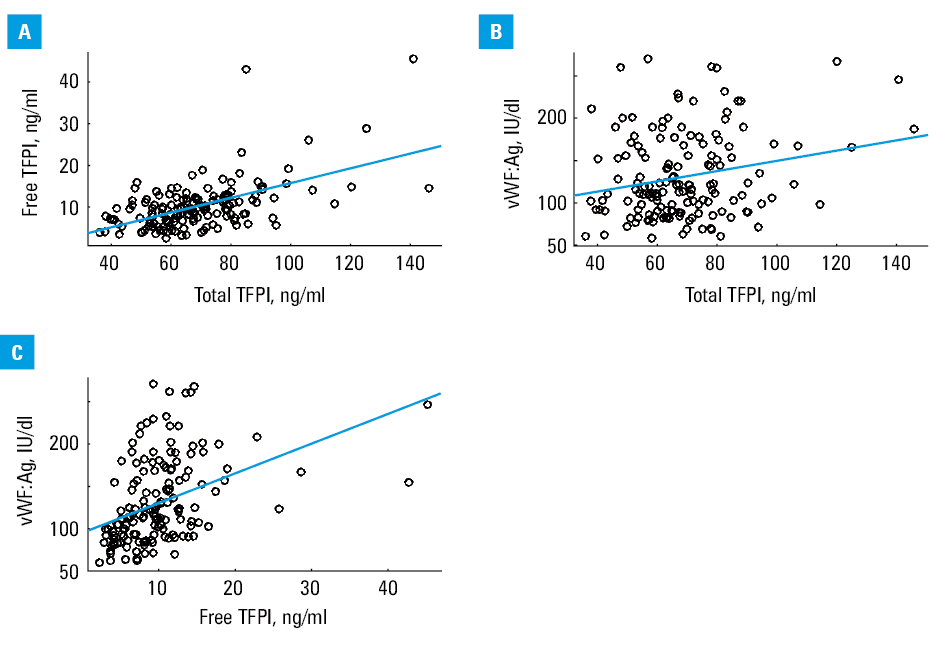
The free TFPI levels correlated with total TFPI levels (r = 0.56; P <0.001) (Figure 1A). Free and total TFPI levels correlated with the vWF level (r = 0.41; P <0.001 and r = 0.22; P <0.001; respectively; Figure 1Band 1c). In terms of correlations with inflammatory markers, the total TFPI level did not correlate with the CRP level (r = 0.02; P = 0.89 for CD; r = 0.09; P = 0.52 for UC). In the CD group, the total TFPI level was positively correlated only with the PLT count (r = 0.3; P = 0.04), and in the UC group, it was negatively correlated only with the albumin level (r = –0.32; P = 0.02). The free TFPI level was correlated with the levels of the following inflammatory markers: fibrinogen (r = 0.4, P = 0.003 for UC; r = 0.36, P = 0.01 for CD); CRP (r = 0.55, P <0.001 for UC; r = 0.45, P <0.001 for CD), PLT count (r = 0.39, P = 0.003 for UC; r = 0.3, P = 0.03 for CD), and albumin (r = –0.05, P <0.001 for UC; r = –0.45, P <0.001 for CD). The free TFPI level was correlated with disease activity in patients with CD and those with UC (r = 0.29; P = 0.04 and r = 0.5; P <0.001, respectively). Patients with CD complications showed higher free TFPI levels than those with complication‑free CD (P = 0.004).
Von Willebrand factor level
The vWF level was higher in patients with UC and those with CD than in controls (P <0.001 for both groups). Moreover, the median vWF concentrations in the inactive and active UC and CD groups were higher than in controls (Tables 2and 3). In patients with CD, the vWF level was positively correlated with CD activity (r = 0.32; P = 0.02) and the CRP level (r = 0.42; P = 0.002). In the UC group, the vWF level was positively correlated with the PLT count (r = 0.3; P = 0.03) as well as the CRP (r = 0.27; P = 0.047) and fibrinogen (r = 0.39; P = 0.003) levels, but not with disease activity (r = 0.15; P >0.05).
Discussion
To our knowledge, this study is the first to show that the levels of free TFPI are positively correlated with the disease activity and the levels of other inflammatory markers in patients with UC and CD. TFPI is produced by vascular endothelial cells, megakaryocytes, platelets, fibroblasts, and mesangial cells.16 Most TFPI remains in the endothelium, and about 15% is released into the blood.17 Plasma TFPI is largely associated with lipoproteins (80%); about 20% is in the (active) free form.18,19 Plasma TFPI levels correlate with low‑density lipoprotein levels.19 Free plasma TFPI exerts an anticoagulant activity by inhibiting the action of the TF/factor VIIa complex.20,21 The TFPIα isoform also inhibits the action of the prothrombinase complex that assembles prior to thrombin formation.22 An increase in the level of free TFPI may be attributed to vascular endothelial damage.23 Elevated free TFPI levels have been observed in patients with various inflammatory diseases, including rheumatoid arthritis, sepsis, and systemic lupus erythematosus.24-26 Elevated total TFPI levels are also observed in patients with obliterative atherosclerosis, Buerger disease, advanced malignant tumors,12 chronic obstructive pulmonary disease, acute respiratory distress syndrome, and severe pancreatitis with organ failure.17,27,28
Bernhard et al29 assessed whether children with CD were at greater risk of thrombin formation. A positive correlation was shown between pediatric CD status and the thrombin level, but the TFPI level did not differ significantly between those with active and inactive disease. Surprisingly, the mean TFPI level was significantly lower in patients with CD than in controls.29 Similarly, Kouhutova et al30 found no difference in TFPI levels between patients with IBD and healthy individuals, or between those with active and inactive disease. On the contrary, we found that the median total TFPI level was higher in patients with IBD than in controls. However, we did not observe such differences between CD and UC groups and controls, which may result from a small study sample. Similarly, Bernhard et al29 studied a group of only 22 patients. At the same time, it should be emphasized that in our study the differences between the subgroups with active disease and controls were of borderline significance. This discrepancy may be attributed to differences in the definition of IBD exacerbation, which in the study by Kouhutova et al30 was based only on the CRP level (>5 mg/l).
We found that the free TFPI level was significantly elevated in patients with active IBD and in those in remission compared with healthy controls. No difference was observed between those with active and inactive disease. The free TFPI level was associated with the clinical activity of CD and correlated with the levels of objective markers of inflammation. Previous studies have documented correlations between TFPI levels and the severity of inflammation. Ohair et al25 reported a trend toward higher levels of TFPI, especially free TFPI, in patients with septic shock compared with those with sepsis. He et al31 observed higher TF and TFPI levels in colon biopsy specimens from patients with UC compared with controls, perhaps indicating that TF is involved in the hypercoagulation and microthrombosis evident in patients with UC.However, Reichman‑Warmusz et al32 reported that endothelial cells in colon biopsy specimens from patients with newly diagnosed IBD revealed only weak TFPI staining.
Tissue factor pathway inhibitor is not only involved in the extrinsic coagulation pathway but also exerts an anti‑inflammatory effect.33 During inflammation, activated endothelial cells demonstrate increased surface TFPI levels.33 TFPI inhibits leukocyte activation, microparticle formation in the extracellular matrix, and expression of tumor necrosis factor α, interleukin 6, and interleukin 1.34 High levels of total and free TFPI may enhance atherosclerotic lesions in coronary vessels, perhaps explaining the relationship between IBD and cardiovascular disease.11 We found no correlation according to sex, age, smoking status, or disease duration, consistent with the observations of Radziwon et al,35 who reported that TFPI concentrations in plasma samples from 100 healthy subjects did not differ by age, sex, or smoking status.
Von Willebrand factor, an acute‑phase protein, negatively regulates angiogenesis, modulates apoptosis, and serves as a marker of endothelial damage.36-38 Von Willebrand factor is synthesized by endothelial cells and (to a lesser extent) by megakaryocytes, and is stored in the Weibel–Palade bodies of endothelial cells and in α-PLT granules.39 The levels of vWF increase in patients with various inflammatory diseases (including IBD), usually in an endothelial cell–dependent manner.34,37,38 Von Willebrand factor affects inflammation through several means, including recruitment of leukocytes.38 The vWF concentration in our patients with IBD was similar to those in previous studies, which showed elevated concentrations as compared with controls.36,40,41 A positive correlation was evident between the free TFPI and vWF levels, confirming an association between TFPI expression and endothelial dysfunction.42
Our study has certain limitations. First, our study groups were rather small. Second, we did not separately measure the levels of vWF and the vWF propeptide. Thus, we did not distinguish between acute and chronic inflammation. We also did not measure low‑density lipoprotein levels, which might affect the total TFPI level. Finally, this was a case‑control study and patients were not followed in terms of thromboembolic events.
This study is the first to show that the anticoagulant TFPI pathway is activated during remission and flare in patients with IBD. Free TFPI levels were correlated with the levels of biochemical markers of inflammation, and with disease activity.
- Owczarek D, Cibor D, Glowacki MK, et al. Inflammatory bowel disease: epidemiology, pathology and risk factors for hypercoagulability. World J Gastroenterol. 2014; 20: 53‑63. | Crossref
- Krakowska‑Stasiak M, Cibor D, Domagala‑Rodacka R, et al. Insulin‑like growth factor systemin remission and flare of inflammatory bowel diseases. Pol Arch Intern Med. 2017; 127: 832‑839.
- Moniuszko A, Głuszek S, Rydzewska G. Rapid fecal calprotectin test for prediction of mucosal inflammation in ulcerative colitis and Crohn disease: a prospective cohort study. Pol Arch Intern Med. 2017; 127: 312‑318.
- Mach T, Szczeklik K, Garlicka M, Owczarek D. Oral ulceration in patient with active Crohn’s disease. Przegl Gastroenterol. 2007; 2: 210‑213.
- Cibor D, Domagala‑Rodacka R, Rodacki T, et al. Endothelial dysfunction in inflammatory bowel diseases: pathogenesis, diagnosis and implications. World J Gastroenterol. 2016; 2: 1067‑1077. | Crossref
ARTICLE INFORMATION