Costs of pharmacotherapy of chronic obstructive pulmonary disease in relation to changing Global Initiative for Chronic Obstructive Lung Disease guidelines (2007, 2011, and 2017 updates)
Key words: chronic obstructive pulmonary disease, clinical burden, economic burden, Global Initiative for Chronic Obstructive Lung Disease


 CC BY-NC-SA 4.0
Costs of pharmacotherapy of chronic obstructive pulmonary disease in relation to changing Global Initiative for Chronic Obstructive Lung Disease guidelines (2007, 2011, and 2017 updates)
Introduction: Chronic obstructive pulmonary disease (COPD) is one of the most common chronic noninfectious diseases. The clinical management is determined by patient assignment to the severity stage of the disease in accordance with the Global Initiative for Chronic Obstructive Lung Disease (GOLD) guidelines.
Objectives: Our aim was to determine the economic implications of changing GOLD guidelines (2007, 2011, and 2017 updates) and their impact on the direct costs of pharmacological treatment of patients diagnosed with COPD.
Patients and methods: This analysis was based on data provided by a group of 298 out of 500 randomly selected primary care physicians in Poland (response rate, 59.6%). Each primary care physician provided information on 10 consecutive patients with COPD. These data were used to simulate the economic consequences of the 2007, 2011, and 2017 GOLD guideline updates.
Results: Regardless of the GOLD guidelines used, pharmacotherapy of patients with a very severe form of COPD was most expensive. Pharmacotherapy costs would be reduced with each subsequent guideline. In the same group of 2597 COPD patients, the average monthly cost of the first‑line pharmacotherapy as well as the overall costs of pharmacotherapy (first- and second‑line) per patient would be the lowest when applying the therapeutic regimen in accordance with the 2017 GOLD guidelines.
Conclusions: Implementation of 2011 and 2017 GOLD guidelines, as compared with the 2007 update, would result in a reduction of direct costs of COPD treatment.
Introduction
Chronic obstructive pulmonary disease (COPD) is associated with enormous global health burden.1-3 It is estimated that approximately 200 million people worldwide suffer from COPD.2,3 Each year, the European Union countries spend approximately 6% of their total health care budgets on the direct costs of respiratory diseases, wherein more than half of this amount (56%) is spent on COPD.3,4 According to data from the European Lung White Book, the total annual costs of COPD in the European Union countries are estimated at 48.4 billion EUR: 23.3 billion EUR of direct healthcare costs and 25.6 billion EUR of indirect costs related to lost productivity.5 Almost one‑third of the total direct costs of COPD were drug costs.5 It is estimated that the costs of COPD pharmacotherapy can reach up to 7.1 billion EUR annually.5
Pharmacotherapy plans for patients with COPD are suggested through the international guidelines developed by the Global Initiative for Chronic Obstructive Lung Disease (GOLD).6-8 The clinical management is determined by patient assignment to the severity stage of the disease in accordance with GOLD guidelines. Every few years, major revisions are made to the GOLD documents, including changes in the years 2007, 2011, and 2017.6-8
Our aim was to determine the economic implications of changing GOLD guidelines (2007, 2011, and 2017 updates) and their impact on the direct costs of pharmacological treatment of patients diagnosed with COPD.
Patients and methods
This analysis was based on data from a cross‑sectional survey performed among 298 (of the 500 invited) randomly selected primary care physicians in Poland. Each physician provided information on 10 consecutive COPD patients, as described previously.9 These data were used to inform a retrospective simulation analysis, in which the 3 sets of the GOLD guidelines (2007, 2011, and 2017) were applied to each patient’s data to predict COPD severity stage for each subject, using the 3 classification schemes as previously described.9 Changes in the assignment of a COPD patient to a specific category of clinical disease severity following application of the 2011 and 2017 GOLD guidelines were described in detail in a previous article9 and were the basis of the current analysis to predict costs. Recommended COPD pharmacotherapy regimens were determined, also based on the 3 sets of the 2007, 2011, and 2017 guidelines.6-8
Severity definitions of chronic obstructive pulmonary disease and pharmacological treatment algorithms
Based on the individual questionnaire–derived data, patients were assigned to the individual therapeutic groups according to the 2007, 2011, and 2017 guidelines.6-8 As criteria of correct COPD management, we used the sets of drugs recommended in each GOLD update (2007, 2011, and 2017) dedicated to the specific severity stage of COPD.6-8
Economic effects of GOLD guideline updates The economic analysis of the costs of COPD pharmacotherapy included all active medicinal ingredients (molecules) available in Poland, which were recommended for use in each particular stage of COPD management according to the 2007, 2011, and 2017 GOLD guidelines. The treatment costs (based on average retail prices) were determined by the Minister of Health’s announcement on the list of reimbursed medicines, foodstuffs for particular nutritional uses, and medical devices (March 1, 2017).10 The costs were assessed for each version of the guidelines by referring to the 2017 prices of medicinal products.
Due to the multitude of available medicinal products, even within one active medicinal ingredient (molecule), 3 levels of costs for each class of medication were indicated: 1) minimum, determining the cost of a monthly therapy with the cheapest equivalent for a given active molecule or therapeutic class from the Anatomical Therapeutic Chemical Class 4th level (ATC4); 2) average, determining the average cost of a monthly therapy based on all prices of available equivalents for a given active molecule or therapeutic class from ATC4; and 3) maximum, determining the cost of a monthly therapy using the most expensive equivalent for a given active molecule or therapeutic class from ATC4.
In the presented calculations, when estimating prices for combined therapies (eg, short‑acting muscarinic antagonist + short‑acting β2-agonists), the price of 2 separate preparations containing a single substance was considered as well as combination therapies (combining 2 or more substances in a single preparation).
Defined daily dose
In all cases, the cost of pharmacotherapy was calculated for a monthly therapy corresponding to 30‑day treatment according to the defined daily dose (DDD) with possible partial modifications to the dosage based on the applicable Summary of Product Characteristics. Each packaging of the medicinal product was marked with the number of DDDs in the packaging in order to calculate the cost of a monthly therapy in the case of products containing the amount of substance that would be sufficient for a different period at DDD dosage (eg, 2 months, 3 months).
Treatment intensity
The intensity of treatment was included during preparation of the economic analysis. This was based on GOLD recommendations, severity level, and the results of the cross‑sectional survey. Treatment intensity assumptions are presented in Table 1. In brief, it was assumed that patients with mild severity according to the GOLD guidelines received 50% of the DDD; patients classified with moderate or severe disease received 100% of the DDD; and those with very severe disease received 150% of the DDD, due to the fact that they would receive the same groups of drugs as patients in the severe form of COPD according to the 2007 GOLD guidelines, but with a high intensity.6
Classification | Treatment intensity assigned |
Abbreviations: DDD, defined daily dose; GOLD, Global Initiative for Chronic Obstructive Lung Disease | |
GOLD 2007 – mild | 50% DDD |
GOLD 2011 – category A | 50% DDD |
GOLD 2017 – category A | 50% DDD |
GOLD 2007 – moderate | 100% DDD |
GOLD 2011 – category B | 100% DDD |
GOLD 2017 – category B | 100% DDD |
GOLD 2007 – severe | 100% DDD
65% of patients would receive theophylline |
GOLD 2011 – category C | 100% DDD
65% of patients would receive theophylline |
GOLD 2017 – category C | 100% DDD |
GOLD 2007 – very severe | 150% DDD
75% of patients would receive theophylline |
GOLD 2011 – category D | 150% DDD
75% of patients would receive theophylline |
GOLD 2017 – category D | 150% DDD |
The simulations of the economic consequences of the GOLD guideline updates were conducted in 2 ways. The first method assumed that all patients were treated with the first‑line treatment according to the GOLD treatment regimens. Based on the data obtained from the cross‑sectional study, we estimated that 40% of patients will not respond to the first‑line (preferred) treatment and will be required to include additional (second‑line) treatment. The second method of analysis included using both first‑line (60% of patients) and second‑line (40% of patients) treatment scenarios. In addition, based on the frequency of use of theophylline obtained from the cross‑sectional survey, we calculated the percentage of patients who would require theophylline as a second‑choice treatment (Table 1). It was assumed that 65% of patients with severe disease and 75% of those with very severe disease would receive theophylline treatment. Economic analyses were carried out in 2 ways. The first option assumed that all patients were treated with first‑line treatment in accordance with the GOLD treatment regimens, while in the second variant of analysis, both first- and second‑line treatments were included. The authors are aware that the 2017 GOLD guidelines do not include second‑line treatment, which is defined as an alternative choice or other possible treatments. However, in order to facilitate the message to the reader, this treatment was called second‑choice treatment.
As criteria of correct COPD treatment, we used the sets of drugs recommended in particular GOLD editions (2007, 2011, and 2017) dedicated to the specific severity stage of COPD and described in Supplementary material, Tables S1-S3.6-8 To refine our analyses, our simulation is limited only to 2 scenarios. The range of therapy costs in some drug groups, such as inhaled steroids, is very wide. This results from the cost calculation methodology, which assumes the patient can be treated with any available form of medicine used for inhalation treatment (eg, suspensions, nebulizer powder).
The costs of pharmacotherapy are expressed in EUR. Based on the average exchange rate of the National Bank of Poland for 2018, 1 EUR is 4.25 PLN.11
Detailed assumptions for the economic analysis, as well as retail prices (for DDD = 100%), are described in Supplementary material, Table S4.
Statistical analysis
Data analysis was performed using the procedures available in the Statistica 12 package (TIBCO Software Inc., Palo Alto, California, United States). Descriptive statistics were used to present the distributions of the quantitative variables. The arithmetic mean, minimum, and maximum values were used to calculate the cost of drugs.
Ethics
This study was carried out in accordance with the principles expressed in the Declaration of Helsinki. The data analysis involved only anonymous records provided by general practitioners, who abstracted patient files and prepared specific information according to the study questionnaires. The study team had no direct contact with these patients at any stage of the project. Individual patient data were coded in an anonymous manner to prevent the identification of the patient or physician by any member of the research team at any stage of the study. According to the Ethical Review Board at the Medical University of Silesia, Poland, scientific simulation based on an anonymous, questionnaire‑based cross‑sectional study does not require separate patient consent.
Results
A group of 298 general practitioners (59.6% of invited) provided information on 2597 patients with COPD (women, 35.3%), aged 29 to 96 years (mean [SD] age, 61.6 [11.1] years). Based on the 2007 GOLD guidelines, 13.1% of patients were classified as having mild disease, while 26.7%, 56.7%, and 3.4% were classified as having moderate, severe, and very severe stages of COPD, respectively. Stages A, B, C, and D, based on the 2011 GOLD guidelines were reported in 14.8%, 10.4%, 39.7%, and 35.1% of patients. According to the 2017 GOLD guidelines, there were 46.8%, 23.8%, 7.7%, and 21.6% of patients classified as having mild, moderate, severe, and very severe stages of COPD, respectively.
The costs of a particular pharmacotherapy treatment regimen (DDD = 100%) for specific severity classifications based on the different editions of the GOLD guidelines are presented in Tables 2‑4.
Range of costs | Monthly cost of pharmacotherapy according to GOLD 2007 | |||||||
First‑line choice | Second‑line choice | |||||||
a Including the cost of theophylline pharmacotherapy
Abbreviations: see Table 1 | ||||||||
I | II | III | IV | I | II | IIIa | IVa | |
Average cost | 6.55 | 29.53 | 67.54 | 67.54 | – | – | 70.45 | 70.45 |
Minimal cost | 3.52 | 16.12 | 21.44 | 21.44 | – | – | 23.69 | 23.69 |
Maximal cost | 21.85 | 55.89 | 219.70 | 219.70 | – | – | 223.44 | 223.44 |
Range of costs | Monthly cost of pharmacotherapy according to GOLD 2011 | ||||||||||
First‑line choice | Second‑line choice | ||||||||||
a In categories C and D, theophylline was considered: average cost, 2.91 (range, 2.26–3.74) EUR.
Abbreviations: see Table 1 | |||||||||||
A | B | C | D | A | B | Ca | Da | ||||
Option 1 | Average cost | 8.17 | 30.86 | 50.36 | 50.36 | 30.86 | 45.40 | 45.40 | 68.87 | ||
Minimal cost | 3.52 | 25.32 | 17.92 | 17.92 | 25.32 | 37.92 | 37.92 | 30.63 | |||
Maximal cost | 21.85 | 34.04 | 190.26 | 190.26 | 34.04 | 60.49 | 60.49 | 197.84 | |||
Option 2 | Average cost | 4.93 | 15.10 | 30.86 | 30.86 | 15.10 | – | – | 75.95 | ||
Minimal cost | 4.10 | 12.60 | 25.32 | 25.32 | 12.60 | – | – | 43.23 | |||
Maximal cost | 6.32 | 26.45 | 34.04 | 34.04 | 26.45 | – | – | 224.30 | |||
Option 3 | Average cost | – | – | – | – | 11.86 | – | – | 111.96 | ||
Minimal cost | – | – | – | – | 7.61 | – | – | 79.52 | |||
Maximal cost | – | – | – | – | 28.17 | – | – | 251.86 | |||
Option 4 | Average cost | – | – | – | – | – | – | – | 45.40 | ||
Minimal cost | – | – | – | – | – | – | – | 37.92 | |||
Maximal cost | – | – | – | – | – | – | – | 60.49 | |||
Option 5 | Average cost | – | – | – | – | – | – | – | 92.46 | ||
Minimal cost | – | – | – | – | – | – | – | 86.92 | |||
Maximal cost | – | – | – | – | – | – | – | 95.64 | |||
Range of costs | Monthly cost of pharmacotherapy according to GOLD 2017 | |||||||||
First‑line choice | Second‑line choice | |||||||||
Abbreviations: see Table 1 | ||||||||||
A | B | C | D | A | B | C | D | |||
Option 1 | Average cost | 8.17 | 15.10 | 30.86 | 45.40 | – | – | 50.36 | 30.86 | |
Minimal cost | 3.52 | 12.60 | 25.32 | 37.92 | – | – | 17.92 | 25.32 | ||
Maximal cost | 21.85 | 26.45 | 34.04 | 60.49 | – | – | 190.26 | 34.04 | ||
Option 2 | Average cost | 4.93 | 30.86 | 45.40 | 75.95 | – | – | – | 50.36 | |
Minimal cost | 4.10 | 25.32 | 37.92 | 43.23 | – | – | – | 17.92 | ||
Maximal cost | 6.32 | 34.04 | 60.49 | 224.30 | – | – | – | 190.26 | ||
Option 3 | Average cost | 15.10 | 45.40 | – | – | – | – | – | 137.55 | |
Minimal cost | 12.60 | 37.92 | – | – | – | – | – | 104.83 | ||
Maximal cost | 26.45 | 60.49 | – | – | – | – | – | 285.90 | ||
Option 4 | Average cost | 30.86 | – | – | – | – | – | – | – | |
Minimal cost | 25.32 | – | – | – | – | – | – | – | ||
Maximal cost | 34.04 | – | – | – | – | – | – | – | ||
There is a direct relationship between COPD severity stage and the cost of monthly pharmacotherapy. Regardless of the GOLD guidelines used, the most expensive option would be the pharmacotherapy of patients with a very severe form of COPD according to the 2007 GOLD guidelines or in category D according to the GOLD 2011 and 2017 (Table 5).
COPD severity stage | Monthly cost of COPD pharmacotherapy | |||||
First‑line pharmacotherapy; cost per patient; EUR Average cost (min–max) | First- and second‑line pharmacotherapy; cost per patient; EUR Average cost (min–max) | |||||
a According to the 2007 GOLD guidelines; b According to the 2011 or 2017 GOLD guidelines; c 50% defined daily dose
d 150% defined daily dose
Abbreviations: COPD, chronic obstructive pulmonary disease; min–max, minimal and maximal; others, see Table 1 | ||||||
GOLD 2007 | GOLD 2011 | GOLD 2017 | GOLD 2007 | GOLD 2011 | GOLD 2017 | |
Milda/Ab | 3.28c (1.76–10.93) | 3.28c (1.76–10.93) | 7.38c (1.76–17.02) | 3.28c (1.76–10.93) | 5.82c (1.76–17.02) | 7.38c (1.76–17.02) |
Moderatea/Bb | 29.53 (16.12–55.89) | 22.98 (12.60–34.04) | 30.45 (12.60–40.33) | 29.53 (16.12–55.89) | 31.95 (12.60–60.49) | 30.45 (12.60–40.33) |
Severea/Cb | 67.54 (21.44–219.70) | 40.61 (17.92–190.26) | 38.13 (25.32–60.49) | 68.29 (22.19–220.45) | 43.28 (17.92–190.26) | 43.02 (17.92–190.26) |
Very severea/Db | 101.31d (32.15–329.55) | 60.92d (26.88–285.39) | 91.01d (56.88–336.45) | 102.62d (33.46–330.85) | 85.22d (26.88–377.79) | 98.36d (26.88–428.85) |
In the group of patients with a mild form of COPD according to the 2007 GOLD guidelines or in category A according to the 2011 or 2017 GOLD guidelines, the average monthly cost of the first‑choice pharmacotherapy and total pharmacotherapy would be the most expensive based on the 2017 GOLD criteria (Table 5). The average monthly cost of the first‑choice pharmacotherapy in the group of patients with moderate COPD according to the 2007 GOLD guidelines or in category B according to the 2011 or 2017 GOLD guidelines would be the lowest when applying the 2011 GOLD guidelines. However, considering all therapeutic options (first- and second‑line pharmacotherapy), the pharmacotherapy regimen according to the 2011 GOLD guidelines would result in the highest cost of pharmacotherapy.
In comparison with the 2007 GOLD guidelines, the application of the 2011 and 2017 GOLD guidelines would reduce the costs of pharmacotherapy in patients with severe and very severe COPD according to the 2007 GOLD guidelines or in category C and D according to the 2011 or 2017 GOLD guidelines. Detailed analysis of the monthly cost of COPD pharmacotherapy, including drugs of first- and second‑line choice and depending on the COPD severity stage, are presented in Table 5.
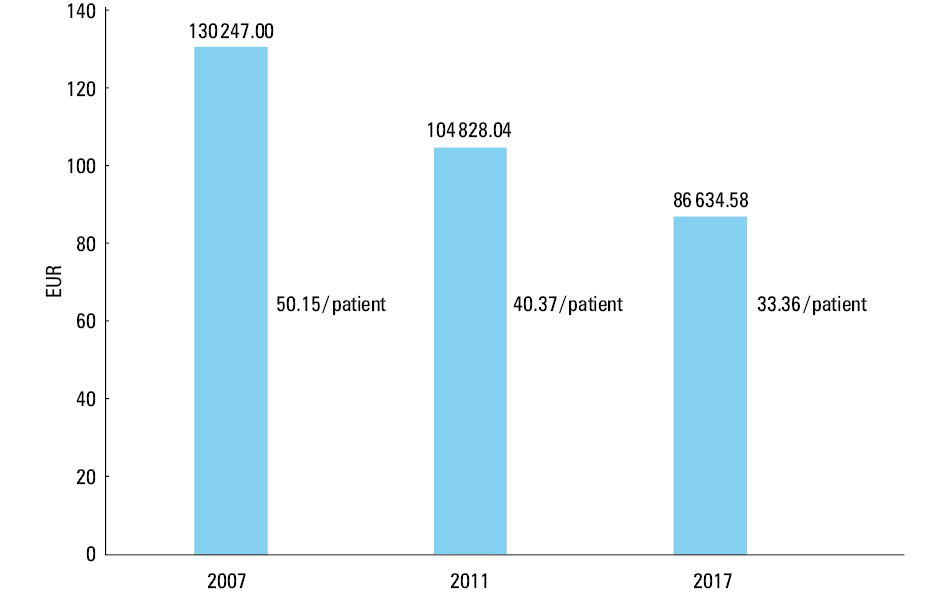
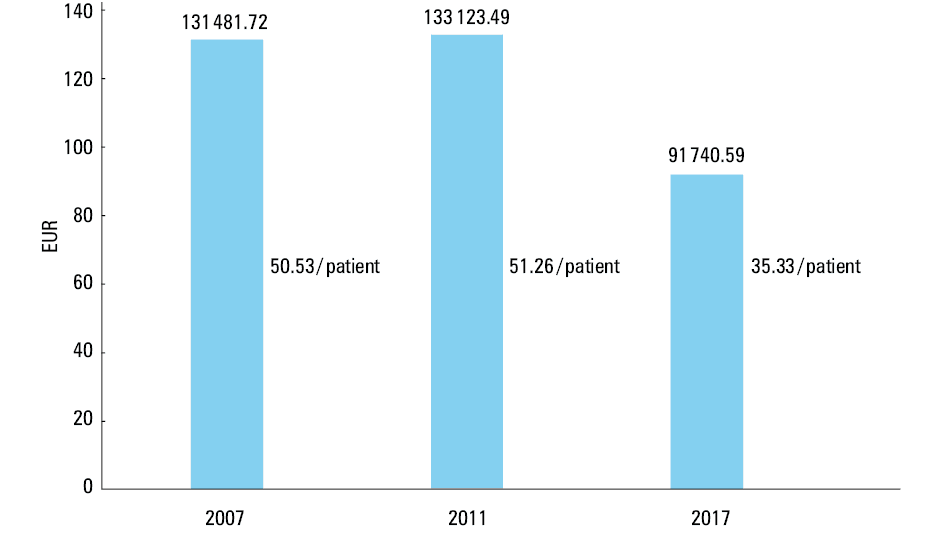
In the same group of 2597 patients with COPD, the average monthly cost of the first‑line pharmacotherapy depending on the applied pharmacotherapy regimen according to the 2007, 2011, and 2017 GOLD guidelines would be the lowest when applying the therapeutic regimen in accordance with the 2017 GOLD guidelines, and the highest in the case of following recommendations according to the 2007 GOLD guidelines (Figure 1). Considering all available therapeutic options (first- and second‑line treatment), in the group of 2597 patients with COPD, the lowest monthly pharmacotherapy cost would be observed when implementing the 2017 GOLD guidelines, and the highest, when implementing the 2011 GOLD guidelines (Figure 2).
Discussion
The updates of the GOLD guidelines have a significant impact on everyday clinical practice. The update from the 2007 guidelines to 2011 and 2017 guidelines affects the classification of patients for particular therapeutic groups.9,12,13 As a result of the reclassification of patients to particular therapeutic groups, the pharmacological regimen used in those patients would also change.9 The change in the frequency of use of individual drug groups affects the costs of pharmacotherapy of COPD patients. Our study showed that the update from the 2007 guidelines to 2011 and 2017 guidelines would significantly change the cost of drugs used in the treatment of COPD with the costs from 2007 being the highest and comparable to those in 2011, while the costs from 2017 were significantly lower.
Currently available data assessing the economic consequences of the update of the GOLD guidelines are very limited. To our best knowledge, this is the first study comparing the cost of pharmacotherapy of COPD patients according to the 2007, 2011, and 2017 GOLD guidelines, although a previous study compared current real‑life costs to costs estimated to be incurred using the 2017 GOLD guidelines.14 With the implementation of each subsequent update of the GOLD guidelines, the costs of pharmacotherapy would be reduced. In the same group of 2597 patients with COPD under the care of primary care physicians, the average monthly cost of the first‑line pharmacotherapy as well as overall costs of pharmacotherapy (first- and second‑line) per patient would be the lowest when applying the therapeutic regimen in accordance with the 2017 GOLD guidelines. These changes may result from a change in the method of assigning patients to COPD severity stages as well as recommendations that introduce the use of some new drugs (phosphodiesterase‑4 inhibitors) or limit the use of some other drugs (inhaled corticosteroids). The 2017 GOLD guidelines recommend less intensive treatment in patients who were assigned to category D. This reduction in the intensity of treatment translates into pharmacotherapy costs. Similar results were reported by Mathioudakis et al.14 After applying the 2017 GOLD recommendations in primary care in the United Kingdom, the mean annual maintenance treatment cost per patient would be reduced from the current cost of 542 GBP to 389 GBP.14 The lack of publications regarding the impact of guideline updates on the economic burden of COPD may suggest that the financial aspect of COPD management is not sufficiently discussed and that the social and economic burden of COPD is not thoroughly investigated.
There is a large range of therapeutic options (2970 combinations of drugs) as well as a wide range of financial costs within the same COPD severity stage, depending on the drug manufacturer and the form of drug administration. The information from this analysis can be used to inform both public and private insurance coverage. In addition, these data can be used to predict costs for a large number of treatment and disease severity categories.
The costs of pharmacotherapy are only part of the total cost of COPD treatment. Direct medical costs resulting from the treatment of COPD, in particular hospitalizations due to COPD exacerbations, also constitute a significant burden for the payer.15 However, this issue was not investigated in the current study. Moreover, the costs of treatment of side effects associated with medicine use should also be considered. In order to calculate the total costs of COPD treatment, not only should the costs of ambulatory intervention be considered but also of ambulatory intervention, hospitalization due to COPD and its exacerbations, smoking cessation services, pulmonary rehabilitation, home oxygen therapy and ventilation support, as well as institutional treatment of patients.
Indirect costs resulting from an inability to work as well as sick leave are also a significant burden for the public payer. According to the analysis of the European Respiratory Society, the indirect costs related to productivity loss due to COPD may even outweigh the costs for the medical care of patients with COPD.5 Another important aspect is also the social burden of COPD. In 2013, COPD was ranked as the fifth leading cause of disability‑adjusted life years lost worldwide.16
In this study, we did not assess the appropriateness of implementation of the GOLD guidelines updates and the pharmacotherapy regimens defined in these recommendations. Our aim was to present the magnitude of changes and their impact on the costs of treatment of COPD patients, both at the individual and population levels. Furthermore, we were not able to assess whether the much more expensive treatment regimens that are based on various active substances and that can be used within the same patient group affect the efficacy of treatment. However, there is evidence that compliance is higher when combination drugs are used and patients adhere to medical recommendations.17-19
This study is a simulation based on the results from a cross‑sectional study, and it does not show how physicians in Poland manage COPD. We assumed the ideal situation that all patients with COPD are treated according to the GOLD guidelines. In real life, the percentage of patients treated according to the GOLD guidelines varies from 35.6% to 67%.20-22 According to general practitioners, some of the main barriers to the implementation of the GOLD guidelines in everyday clinical practice and reasons for low adherence to these guidelines are poor familiarity with recommendations, low self‑efficacy, and time constraints.23
This study has some limitations. A cross‑sectional study, which was the basis of the performed analysis, was conducted among patients with COPD remaining under the care of primary care physicians. Therefore, the economic analysis includes only the costs of drugs used during the monthly (30‑day) pharmacological treatment of chronic COPD. On the basis of these data, it is impossible to determine the costs of hospitalization, treatment of exacerbations, and indirect nonmedical costs of COPD. The treatment intensity was based on GOLD recommendations, COPD severity stage, and the results of the cross‑sectional survey. It should be emphasized that the 2007, 2011, and 2017 GOLD guidelines differ in terms of principles and clinical criteria, which makes simple comparisons problematic.6-8 The assumption of a different treatment intensity (DDD percentage) in the group of patients with the most severe form of COPD could affect the cost of pharmacotherapy. Concomitant diagnoses as well as potential adverse effects of applied drugs may modify treatment regimens, which may also affect the costs of pharmacotherapy. However, our analysis was complicated already with the basic patient characteristics that we included, and thus we were unable to add additional information into the models.
In this study we calculated the average cost of treatment for each severity stage of COPD, depending on 3 different GOLD classifications (2007, 2011, and 2017). These data can be used to estimate the costs of pharmacotherapy for other populations, including ambulatory and in‑hospital patients with COPD. Economic analyses presented in this paper can provide a basis for health authorities, public health specialists, and the insurer or public payer to estimate the economic burden of COPD.
In conclusion, updates from the 2007 to 2011 and 2017 GOLD guidelines on COPD have a significant impact on the costs of pharmacological treatment of patients with COPD. Implementation of the 2011 and 2017 GOLD guidelines, compared with 2007 guidelines, would result in a reduction of direct costs of COPD treatment.
- Mannino DM, Higuchi K, Yu TC, et al. Economic burden of COPD in the presence of comorbidities. Chest. 2015; 148: 138‑150. | Crossref
- The Global Initiative for Chronic Obstructive Lung Disease (GOLD). https://goldcopd.org/. Accessed October 4, 2018.
- May SM, Li JT. Burden of chronic obstructive pulmonary disease: healthcare costs and beyond. Allergy Asthma Proc. 2015; 36: 4‑10. | Crossref
- Ferkol T, Schraufnagel D. The global burden of respiratory disease. Ann Am Thorac Soc. 2014; 11: 404‑406. | Crossref
- European Respiratory Society. European Lung White Book. https://www.erswhitebook.org/chapters/the‑economic‑burden‑of‑lung‑disease/. Accessed October 4, 2018.
SUPPLEMENTARY MATERIAL
ARTICLE INFORMATION