Fluctuations in circulating endothelial progenitor cell levels and acute cardiac graft rejection


 CC BY-NC-SA 4.0
Fluctuations in circulating endothelial progenitor cell levels and acute cardiac graft rejection
Introduction: Endothelial progenitor cells (EPCs) in nontransplant settings have reparative properties. However, their role in heart transplantation (HT) is not well defined.
Objectives: The aim of this study was to prospectively evaluate changes in EPC levels in relation to post‑HT rejection.
Patients and methods: EPC levels were measured in 27 HT recipients for 6 months after HT. Acute cellular rejection (ACR) or antibody‑mediated rejection (AMR) were assessed by right ventricular endomyocardial biopsy.
Results: ACR and AMR were observed in 7 (25.9%) and 6 (22.2%) patients, respectively. The ACR status at 1 month post‑HT did not differ with respect to EPC immediately post‑HT. At 1 month post‑HT in patients without ACR or AMR, EPC levels were significantly reduced compared with the measurements immediately post‑HT (P <0.001). On further follow‑up, EPC levels were similar regardless of the rejection events. Nonetheless, greater changes (coefficient of variation) in EPClog (logarithmic transformation) were associated with the risk of AMR or ACR compared with those without any rejection event (median [lower–upper quartile], 15 [13–18] vs 8 [5–13]; P = 0.02 and 22 [14–26] vs 8 [5–13]; P = 0.01, respectively). The receiver operating characteristic curve showed that the coefficient of variation of EPClog of 12 was the optimal cutoff value for the prediction of rejection (area under the curve = 0.85). Higher levels were associated with greater risk of ACR or AMR (P <0.005).
Conclusions: Early reduction of EPC levels was related to a lower risk of ACR or AMR. Greater changes of EPC‑levels during follow‑up were associated with a significantly higher risk of rejection.
What's new?
The current study presents the prospective evaluation of changes in endothelial progenitor cell levels following heart transplantation and their relation to rejection episodes. To our knowledge, it is the first prospective study evaluating the level of endothelial progenitor cells in patients undergoing heart transplantation. Based on our data, we were able to document the potentially significant role of endothelial progenitor cells in heart transplantation rejection. The most important finding is that grater variation in the cell levels after heart transplantation is associated with higher risk of rejection.
Introduction
Patients undergoing heart transplantation (HT) are at risk of experiencing acute cellular rejection (ACR) or antibody‑mediated rejection (AMR), mainly observed within the first year post‑HT. Although ACR is a well‑recognized risk factor for an unfavorable prognosis, data regarding AMR are not conclusive.1-3 Thus, finding a new biomarker that could allow to identify a rejection episode and provide prognostic information as well as monitor the process is desirable.4
It has been documented that cardiac surgery involves significant interaction between the coronary endothelium and subsequent endothelial progenitor cell (EPC) mobilization.5,6 On the other hand, HT is an exceptional illustration of the complexity of interactions involving endothelium, ischemia/reperfusion (I/R), inflammatory and immunologic activation.7 The endothelium is not a simple monolayer membrane. It can play a significant role not only in vasoregulation, angiogenesis, anticoagulation, and fibrinolysis but also in immune interaction.7 EPCs in nontransplant settings have reparative properties. They adhere to the damaged endothelium and replace destroyed cells, enhancing the healing processes.8-10 In the case of transplantation, endothelial cells of the allograft undergo complex proinflammatory alteration, which may lead to vascular leakiness,11 and during I/R the recipient’s immunocompetent cells encounter the donor’s antigens located on endothelial cells.12 Thus, the allograft endothelium is perceived as a target for interaction with circulating inflammatory factors, cytokines, and antibodies,13 and in HT ischemic injury triggers stem cell mobilization to the donor’s graft.14,15 That is why the EPC homeostatic mechanism may be completely different from that observed in standard settings.16 In such cases, EPCs would be exposed to different conditions, like I/R and a persistent transplantation‑related inflammatory environment. In consequence, their properties may be lost or altered.17 Therefore, it cannot be ruled out that graft rejection and subsequent coronary vasculopathy may be a consequence of an anomalous reparative mechanism of EPCs, secondary to foreign antigenicity18 and may ultimately require retransplantation.19 Nevertheless, the role of EPCs in allograft rejection is not unequivocal.17 The available data are contradictory, with some of the studies confirming an inverse association between the circulating EPCs and graft rejection,20-22 and others suggesting that EPCs contribute to rejection.2,12,16 Therefore, the aim of the study was to assess prospectively the trajectory of EPCs and their association with allograft rejection episodes in HT recipients.
Patients and methods
Patients
This was a prospective observational single‑center study including 27 patients undergoing HT at the Institute of Cardiology (March 2015–February 2017) who survived at least 6 months following the procedure. Patients on any kind of mechanical support before transplantation were excluded. The study was conducted in accordance with the Declaration of Helsinki, the Declaration of Istanbul, and the ethical statement by the International Society for Heart and Lung Transplantation. The study protocol was approved by the local ethics committee. All patients signed the informed consent form.
Acute rejection monitoring
The primary endpoint of the study was either ACR or AMR. ACR was defined as ACR grade 2 or higher based on the right ventricular endomyocardial biopsy result according to the International Society for Heart and Lung Transplantation classification.24 AMR was defined as AMR‑1H and/or AMR‑1I characterized by histopathological changes.25 Patients were initially monitored for acute rejection weekly, and at 2, 3, 6, and 12 months post‑HT and categorized as follows: month 1 (from HT to month 1), month 3 (from month 1 to month 3), month 6 (from month 3 to month 6), and month 12 (from month 6 to month 12). ACR or AMR was coded positive at the designed time intervals if there was at least 1 positive biopsy within the corresponding period. All clinical data regarding comorbidities and etiology of heart failure with reduced ejection fraction were obtained from medical history, reflecting the period prior to commencing the study. The etiology of heart failure (HF) was classified as either ischemic or nonischemic. Neither human leukocyte antigen nor donor‑specific antibodies were monitored prior or post HT, due to low risk of rejection. All patients had negative panel‑reactive antibody test results.
The information regarding efficient immunosuppression was available for 6 months following transplantation. All patients were on a triple immunosuppression protocol, namely, (calcineurin inhibitor [CNI; cyclosporine or tacrolimus]), proliferation inhibitor (mycophenolate mofetil), and tapering glucocorticoids regimen, without any induction prior to the HT. Efficient immunosuppression was coded as follows: optimal (levels of both immunosuppression agents [CNI, mycophenolate mofetil] within required range), suboptimal (level of at least 1 agent within required range), or nonoptimal (levels of both agents below required ranges). Criteria of optimal doses of immunosuppression were as follows: cyclosporine 150 to 400 ng/ml (0–3 months post‑HT), 150 to 300 ng/ml (3–12 months post‑HT); tacrolimus 10 to 20 ng/ml (0–1 month post‑HT), 5 to 15 ng/ml (1–12 months post‑HT); mycophenolate mofetil 1 to 4 µg/ml.
Blood collection and isolation of peripheral blood mononuclear cells
Venous blood was drawn into tubes containing K3EDTA (Sarstedt, 01.1605.001, Nümbrecht, Germany) from all patients within 12 to 24 hours post‑HT and at month 1, 3, and 6 post‑HT before the biopsies. The peripheral blood mononuclear cells (PBMCs) were isolated from whole blood by Lymphoprep gradient centrifugation (STEMCELL Technologies, 07851, Vancouver, Canada). After washing, the cells were frozen (10% dimethyl sulfoxide and 90% fetal bovine serum) and kept in liquid nitrogen until further analysis.
Flow cytometry
To avoid assay‑to‑assay variability, all samples from a single patient were analyzed at the same time. On the day of analysis, cells were thawed and resuspended in a buffer (phosphate‑buffered saline with 40 mM Tris‑HCl at pH 8, 10 mM NaCl, 6 mM MgCl2, 1 mM CaCl2) containing 10 U/ml of DNAse (Sigma, DN25, St. Louis, Missouri, United States). Up to 3 million of PBMC were stained with Zombie NIR Fixable Viability kit (BioLegend, 423106, San Diego, California, United States) for 15 minutes at room temperature. Then, the FcR Blocking Reagent (Miltenyi Biotec, 130‑059‑901, Bergisch Gladbach, Germany) was added and the cells were incubated for 15 minutes at room temperature. For surface markers detection, cells were stained with fluorescently labeled antibodies: CD34‑APC (BD Biosciences, 555824, Franklin Lakes, New Jersey, United States) CD45‑BV510 (BD Biosciences, 563204) VEGFR2‑PE (BD Biosciences, 560494) for 20 minutes at RT. After washing, cells were analyzed using flow cytometry (FACSAria III, BD Biosciences). A fluorescence minus one control without a‑VEGFR2 antibody was prepared for every sample.
EPCs were defined as CD34+CD45dimVEGFR2+ and presented as a number of EPCs per 1 million of PBMCs. On average, there were between 200000 and 1million of living cells analyzed for each test.
Statistical analysis
The population characteristics of patients and groups with and without ACR or AMR events were summarized as means (SD) or medians (Q1, Q3) for continuous variables and as percentages for categorical data. The differences between normally distributed data were tested by the t test or 1‑way analysis of variance. The familywise error rate was corrected by post hoc Tukey–Kramers tests. Repeated measurements of EPClog between different time points (HT and month 1) were compared with the paired t test. Nonnormally distributed data were compared by the nonparametric test (the Kruskal–Wallis test and the Wilcoxon rank sum test). Categorical variables were compared by the Pearson χ2 test or the Fisher exact test.
The calculation of EPC levels was made after natural logarithmic transformation to correct for the skewed distribution. The dynamics of the EPC levels were analyzed by determining the coefficients of variation (CV) for the log‑transformed values measured during follow‑up.
A receiver‑operating characteristic curve analysis was used to assess the cutoff point of the variability of EPC levels (CV EPClog) for prediction of rejection event (either ACR or AMR). The optimal cutoff was defined as the value with the maximal sum of sensitivity and specificity. Time‑to‑event analyses were performed with the use of Kaplan–Meier estimates and were compared with the use of the long‑rank test. All hypotheses were 2‑tailed with a type I error rate of 0.05. All statistical analyses were performed using SAS statistical software, version 9.4 (SAS Institute, Cary, North Carolina, United States).
Results
Our study group included 27 patients who underwent HT. The population characteristics are presented in Table 1. The majority of participants were men (77.8%) and mean (range) age was 50.1 (18.8–66.8) years. The nonischemic etiology was the dominant primary cause of HF (59.3%). The median time since diagnosis of HF was nearly 5 years. During the 12‑month follow‑up, ACR (all events of grade 2) was recorded in 7 cases (25.9%) and AMR in 6 cases (22.2%). All AMR were AMR1h+, there were no cases of AMR1i+. Our study group was characterized by numerous comorbidities. Atrial fibrillation in patient history was the most prevalent comorbidity followed by ischemic heart disease, hypertension, and thyroid disorders. We did not observe higher frequency of comorbidities in the group with AMR or ACR experienced during 12 months of follow‑up. Post‑HT renal failure was recorded in 38.5% and 35.7% (P = 0.89), diabetes mellitus in 76.9% and 64.3% (P = 0.48), and hypertension in 53.8% and 42.9% (P = 0.58) of patients with rejection (either AMR or ACR) and those free from rejection, respectively.
Variable | Total group (n = 27) | ACR (+) or AMR (+) (n = 13) | AMR (–) and ACR (–) (n = 14) | P value |
Data are presented as number (percentage) or median (Q1–Q3).
a Fisher exact test
Abbreviations: ACR, acute cellular rejection; AMR, acute antibody mediated rejection; COPD, chronic obstructive pulmonary disease; TIA, transient ischemic attack | ||||
Age, y | 56.4 (46.3–60.7) | 55.6 (28.0–59.4) | 56.9 (48.2–62.2) | 0.36 |
Heart failure morbidity, y | 4.6 (2.0–8.5) | 3.4 (1.7–8.4) | 4.9 (3.5–8.5) | 0.33 |
Male sex | 21 (77.8) | 11 (84.6) | 10 (71.4) | 0.65a |
Ischemic etiology | 11 (40.7) | 6 (46.2) | 5 (35.7) | 0.58 |
Comorbidities | ||||
Coronary artery disease | 11 (40.7) | 5 (38.5) | 6 (42.9) | 0.82 |
History of atrial fibrillation | 14 (51.9) | 7 (53.8) | 7 (50) | 0.84 |
Hypertension | 8 (29.6) | 2 (15.4) | 6 (42.9) | 0.21a |
Stroke/TIA | 7 (25.9) | 4 (30.8) | 3 (21.4) | 0.68a |
Pulmonary embolism | 3 (11.1) | 0 (0) | 3 (21.4) | 0.22a |
Thyroid disease | 8 (29.6) | 4 (30.8) | 4 (28.6) | 1.00a |
Renal failure | 7 (25.9) | 3 (23.1) | 4 (28.6) | 1.00a |
Pulmonary disease (COPD or asthma) | 4 (14.8) | 1 (7.7) | 3 (21.4) | 0.60a |
Hyperuricemia | 4 (14.8) | 2 (15.4) | 2 (14.3) | 1.00a |
Diabetes mellitus | 3 (11.1) | 1 (7.7) | 1 (14.3) | 1.00a |
Peptic ulcer disease | 3 (11.1) | 1 (7.7) | 1 (14.3) | 1.00a |
In the majority of cases, patients were on optimal or suboptimal immunosuppressive dosing during the entire follow‑up. Those who were at least once on optimal dosing and twice on suboptimal dosing constituted 70% of the entire population, and there was no difference with regard to ACR (P = 0.60) or AMR (P = 0.14). Among patients on CNI, only 2 patients received tacrolimus and 1 experienced rejection (defined as either AMR or ACR) (P = 0.96). The stratification of EPC levels (at 1, 3, and 6 months post‑HT) according to the effectiveness of the immunosuppressive therapy into 2 subgroups, nonoptimal and suboptimal (combined due to very small numbers in the subgroups) as compared with optimal, revealed no differences between the groups at any of the analyzed time points (Table 2).
Time of measurements | Nonoptimal or suboptimal; EPClog (n = 13) | Optimal; EPClog (n = 14) | P value |
Data presented as means (SD) and analyzed by 2 independent samples t test
Abbreviations: HT, heart transplantation; EPClog, endothelial progenitor cells after logarithmic transformation | |||
1 month post‑HT | 4.49 (0.97) | 3.88 (1.43) | 0.21 |
3 months post‑HT | 4.6 (1.11) | 4.81 (1.21) | 0.64 |
6 months post‑HT | 4.35 (1.50) | 4.32 (1.07) | 0.95 |
We found, with respect to ACR status, that EPC levels did not differ significantly either immediately or after the first month post‑HT (Table 3). On the contrary, patients with AMR at 1 month had significantly lower levels of EPC immediately following HT, but there was no difference in EPC levels at 1 month. Moreover, patients without ACR or AMR at 1 month had a decline in EPC levels at 1 month compared with the period immediately after HT, which was not observed in those with either AMR or ACR. For the combined data (either with rejection or without any rejection events) results were alike.
Variable | ACR (+) (n = 3) | AMR (+) (n = 4) | ACR (–) and AMR (–) (n = 20) | P valuee | P valuef ACR (+) vs ACR (–) and AMR (–) | P valuef AMR (+) vs ACR (–) and AMR (–) |
Variable | ACR (+) or AMR (+) (n = 7) | ACR (–) and AMR (–) (n = 20) | P valueg | |||
Data presented as means (SD).
a Paired t test for the difference between M1 and HT; b P = 0.90; c P = 0.87; d P = 0.81; e P <0.001; e One‑way ANOVA; f Post‑hoc Tukey–Kramer test; g Two independent samples t test
Abbreviations: ACR, acute cellular rejection; AMR, acute antibody mediated rejection; ΔEPClog M1–HT, difference in EPClog between M1 and HT; HT, within 24 hours post transplantation; M1, at 1 month post transplantation; others, see Table 2 | ||||||
EPClog HT | 5.14 (1.55) | 3.81 (1.01) | 5.30 (0.88) | 0.033 | 0.97 | 0.025 |
EPClog M1 | 4.97 (0.59) | 3.69 (1.33) | 4.15 (1.29) | 0.42 | – | – |
ΔEPClog M1 – HT | –0.17 (1.98)a,b | –0.12 (1.30)a,c | –1.15 (1.18)a,e | 0.22 | – | – |
EPClog HT | 4.38 (1.34) | 5.30 (0.88) | 0.048 | |||
EPClog M1 | 4.24 (1.21) | 4.15 (1.29) | 0.88 | |||
ΔEPClog M1 – HT | –0.14 (1.47)a,d | –1.15 (1.18)a,e | 0.08 | |||
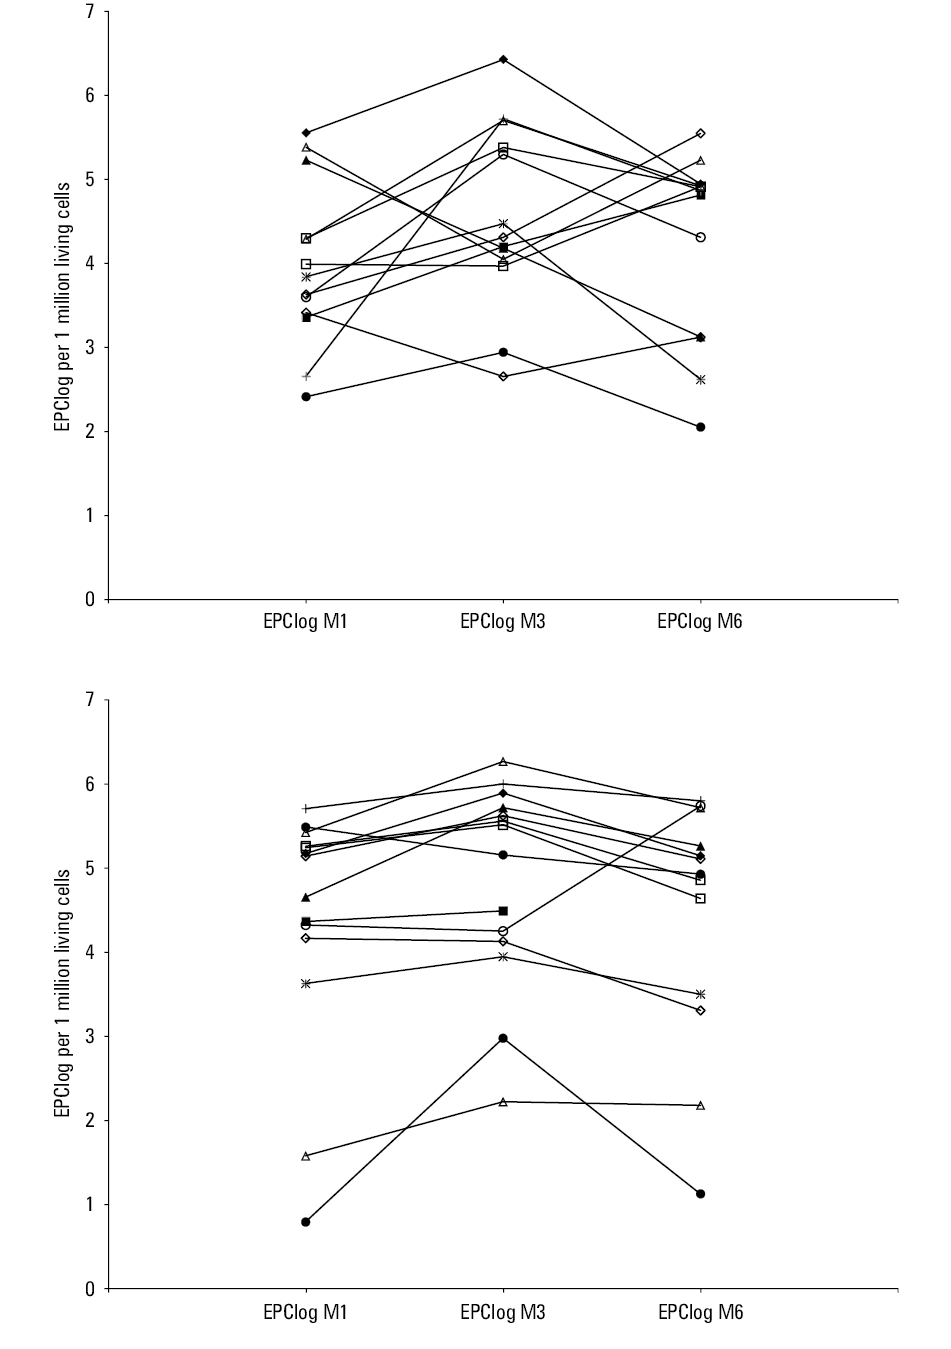
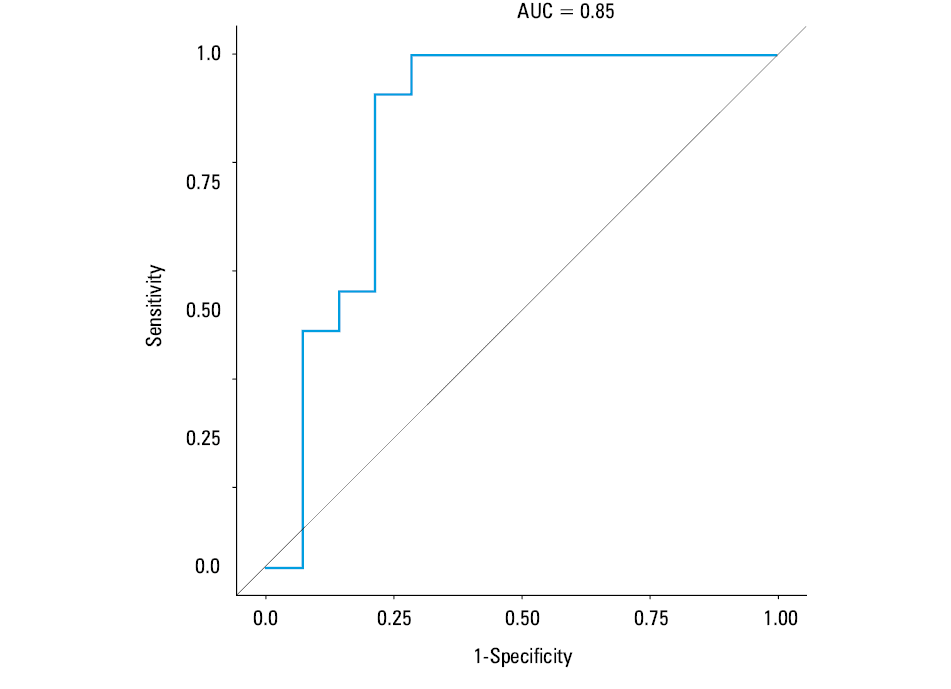
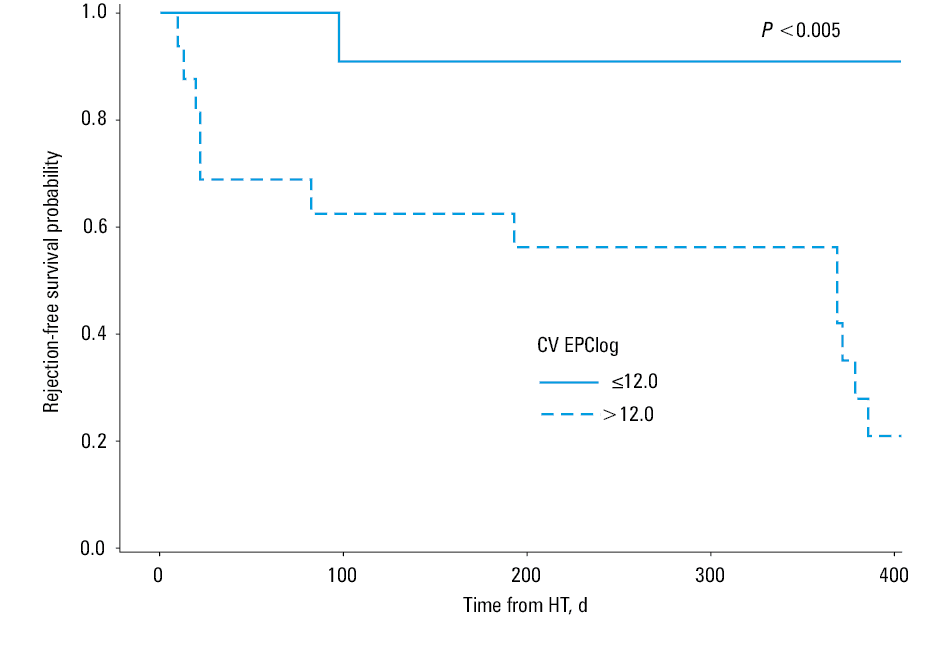
We also analyzed the mean trends of EPC levels and their variation at 1, 3, and 6 months in relation to either AMR or ACR in the course of 1 to 12 months of follow‑up. During the analyzed period, mean levels of EPCs were alike, irrespective of ACR or AMR status (Table 4). Nevertheless, patients with ACR or AMR compared with those free from any kind of rejection had a significantly greater variation of EPC levels expressed by the CV within the analyzed intervals (P = 0.01 and P = 0.02, respectively) (Table 4). Likewise, combining the data for the AMR- or ACR‑positive patients compared with those without any rejection episode did not change the results. There were no differences in age distribution among patients with ACR, AMR, or without any rejection event neither within 1 month post‑HT (median [Q1–Q3], 55.6 [49.1–60.8] years, 24.6 [19.7–44.8] years, and 57.2 [47.9–60.3] years; P = 0.23, respectively) nor during further follow‑up (median [Q1–Q3], 58.4 [49.1–60.7] years, 27.3 [20.6–56.9] years and 57 [48.2–62.2] years; P = 0.14, respectively). Likewise, gender distribution was alike among the groups. The percentage of men was 66.7%, 75%, and 80% within 1 month (P = 0.79) and 85.7%, 83.3%, and 71.4% respectively (P = 0.84) during furhter follow‑up. The variation of EPC levels for each individual between the subsequent assessments of EPC levels during post‑HT follow‑up is presented in Figure 1. To assess the ability of CV EPClog to distinguish those with either AMR or ACR, area under the receiver operating characteristic curve was generated showing significantly predictive value (area under the curve, 0.85) (Figure 2). The annual event‑rate (ACR or AMR) in patients with CV EPClog greater than 12 (n = 16), was higher compared with those with CVEPClog of 12 or less (n = 11) (0.79 vs 0.09; P = 0.005), as shown by the Kaplan–Meier analysis (Figure 3).
Variable | ACR (+) (n = 7) | AMR (+) (n = 6) | ACR(–) and AMR(–) (n = 14) | P value a | P valuea ACR (+) vs ACR (–) and AMR (–) | P valuea AMR (+) vs ACR (–) and AMR (–) |
Variable | ACR (+) or AMR (+) (n = 13) | ACR (–) and AMR (–) (n = 14) | P valueb | |||
Data are presented as median (lower quartile–upper quartile).
a Kruskal–Wallis test; b Wilcoxon rank sum test
Abbreviations: CV, coefficient of variation for the measurements between 1–6 months of follow‑up; EPClog, endothelial progenitor cells after logarithmic transformation during 1–6 months of follow‑up; others, see Table 3 | ||||||
EPCLog | 4.50 (4.18–4.89) | 4.21 (3.07–4.40) | 5.16 (3.87–5.29) | 0.28 | – | – |
CV EPClog | 22 (14–26) | 15 (13–18) | 8 (5–13) | 0.006 | 0.01 | 0.02 |
EPCLog | 4.40 (4.13–4.87) | 5.16 (3.87–5.29) | 0.15 | |||
CV EPClog | 18 (13–22) | 8 (5–13) | 0.02 | |||
Discussion
Our study was designed to investigate the potential role of EPC levels and their variation in ACR and AMR after HT. We found that higher levels of EPC within 24 hours post‑HT were protective with respect to AMR during the first month. Conversely, with regard to ACR, both groups, regardless of their rejection status, were alike. Nevertheless, a greater reduction in EPC levels at 1 month was associated with a lower risk of ACR. During further follow‑up, a greater variation of EPC increased the risk of both ACR and AMR.
In our study, EPCs were defined and evaluated as described by Van Craenenbroeck et al,26 that is, CD34+CD45dimVEGFR2+. Although some reports indicate that CD133 might be a valuable marker of immature EPCs, there are also discrepant findings. As summarized by Fadini et al,27 CD34+CD133+KDR+ cells develop into hematopoietic colonies, whereas the CD34+CD45– population forms endothelial colonies in vitro. Moreover, it has been reported that CD34+KDR+ cells show a better relationship with coronary artery disease and response to statin therapy if restricted to the CD45dim gate.28 As stated by Van Craenenbroeck et al,26 “The major drawback is the fact that CD34+/KDR+/CD45dim cells only constitute between 0.0001 and 0.01% of PBMCs, so their flow cytometric quantification becomes a technical challenge.” Pre‑analytical sample handling, data acquisition and analysis must be taken into account and standardized to encounter a reliable and reproducible enumeration.
Ischemia and reperfusion during cardiac surgery produce a major insult to the vasculature and along with inflammation may lead to endothelial dysfunction and chemo‑attraction of leucocytes/inflammatory cells to cardiac and extracardiac sites.5,29 Blood reperfusion is crucial for the restoration of the metabolic function; however, it is associated with increased reactive oxygen‑nitrogen species production and inflammation reaction, which may lead to a local and remote injury.30 In fact, endothelial dysfunction/injury is a recognized player in multifactorial mechanisms of I/R injury.31 Studies evaluating the EPC during I/R documented not only a mobilization of EPC5,6 but also their protective role during ischemic events after the administration of genetically modified EPC32 or arginine.33
AMR is recognized as histologic evidence of a capillary injury, whereas ACR is diagnosed when interstitial and/or perivascular infiltration along with myocyte damage is observed.24 Thus, in both cases, vascular and primarily endothelial injury is the initial pathophysiological mechanism. The process of recipient EPC engraftment into the donor’s endothelium is well established in renal and cardiac transplantation.34,35 In animal models, evaluation of the endothelial regeneration of the allograft by the recipient’s EPC brought conflicting results.15,36 However, in the majority of human studies, endothelial chimerism was detected in almost one‑fourth of the cells in transplanted human hearts.34,37 In another study evaluating EPC chimerism in renal transplants, researchers identified the donor’s endothelium replacement by the recipient’s cells to be a marker of rejection.35 Moreover, in cases of severe rejection, the vascular endothelium is damaged and replaced by a recipient’s EPCs.35 All of these observations are in line with our findings regarding AMR. In the case of AMR, which can take place at any time, even within the first few days post‑transplantation, low numbers of EPCs observed in our patients immediately post‑I/R injury might not offer sufficient protection from a cascade of events leading to AMR.
It has been postulated that the immunologic vascular‑endothelial injury in acute rejection events and the associated activation of numerous cytokines and chemokines stimulate migration of progenitor cells to the site of injury.38 In fact, ACR was related with endothelial dysfunction39 regardless of the time of testing. On the other hand, it has been suggested that EPCs are mobilized from the recipient’s bone marrow and seeded into the microcirculation of the allograft during an immunologically related myocardial injury.40 In renal transplantation, the replacement of donor’s endothelial cells and its association with vascular and interstitial rejection is documented.35,41 Therefore, it cannot be excluded that EPCs may play a significant role in rejection and vasculopathy processes also in HT.18,42 Indeed, the majority of studies postulated an unfavorable role of EPCs and an increased risk associated with post‑HT vasculopathy.18,37,43 Interestingly, patients with vasculopathy had lower EPC levels compared with patients with preserved vascular function, postulating a defective mobilization mechanism.43 Of note, in those studies, time of assessment was chosen individually,37,43 and neither of the studies evaluated EPCs prospectively and limited the assessment to a randomly chosen interval from HT.16,37,43 Therefore, no information regarding an earlier rejection status and changes in EPC levels was provided. Much less is also known about the potential correlation between EPC and the risk of either ACR or AMR during the early phase following transplantation.16 An interesting observation was made in one study evaluating EPC fluctuation immediately following renal transplantation.23 The authors observed a significant reduction in EPC levels within hours post‑renal transplantation compared with preoperative testing, with a steady increase thereafter. However, and still in line with our observations, in patients with preserved allograft function, EPC level reduction was much more pronounced.23 It might be speculated that EPC contribution is important in the endothelial repair immediately after I/R injury. On the other hand, in some studies regarding a renal transplant model, the opposite was documented, showing a positive association of EPC levels with the renal graft function or cardiovascular event‑free survival.44,45 Moreover, it was shown that EPC levels were not associated with gender, age, acute allograft rejection,44 and immunosuppressive regiment44,45; however, the time frame from transplantation with respect to EPC sampling was not precisely defined.44,45
Contrary to the renal model, in HT, most of the data suggest an unfavorable role of EPC in modifying the rejection risk post‑HT.16,42,43,46 In those studies, a detrimental effect of elevated EPC or function with respect to the risk of acute rejection was recognized.16,42,46 Decreased level of EPCs was not associated with a microvascular dysfunction43 and EPCs impaired function was suggested as a mechanism preventing rejection.16,46 On the contrary, there is also evidence that high levels of chimerism involving a recipient’s EPCs might offer protection against graft failure.34 In a recent analysis, the authors evaluated the association between the ratio of regulatory T cells (Tregs) and EPC representing the equilibrium of the 2 opposing mechanisms. The main finding of this study was that lower Treg‑to‑EPC ratio was related with rejection risk during a long‑term follow‑up.42 Thus, an increase in EPCs level was associated with an increased risk of rejection.
Neither of the HT studies tested EPC levels or function prospectively. At the same time, it was postulated that the pathogenesis of endothelial dysfunction during follow‑up suggests an episodic nature of the immunologic injury.39 Therefore, in this respect, our study is unique in providing information regarding EPC trajectory during the first 6 months post‑HT. Based on our results, and in agreement with previous reports,16,42,43,46 we may speculate that EPC levels, and especially their dynamic changes during follow‑up, may not play the role of a bystander but be actively involved in pathological processes post‑HT.
Limitations
Interpretation of the presented results must be viewed in the context of some limitations. It was a single‑center study and our study sample was small, although we were still able to find a significant association between the changes of EPC and rejection risk. Secondly, during post‑HT follow‑up, many factors, including pharmacotherapy and various complications, could potentially provide some bias. Nevertheless, our methodology in this respect is in agreement with previous publications. It must be also stated that despite the prospective nature of our study, our results do not provide a clear clinical implication as the major conclusions were limited to dynamic changes during longer follow‑up post‑HT.
Conclusions
Assessment of dynamic changes in EPC levels following HT brings important information with regard to the risk of ACR and AMR. The dynamic changes in the levels of EPCs observed within 6 months post‑HT were associated with the risk of rejection. Although we are not able to show a direct causative effect of the changes of EPC levels in relation to the risk of rejection, the obtained data implicate a significant role of EPCs in the pathological processes after HT. It may suggest the important role of EPC levels and their fluctuation in the rejection process; however, it requires further studies. Elucidating the mechanisms of this phenomenon in the future may enhance the prevention of graft rejection and failure.
- Zieliński T, Sobieszczańska‑Małek M, Karczmarz M, et al. Lack of impact of presence of positive c4d staining in capillaries in myocardial biopsies on long‑term survival of heart transplant patients. Transplant Proc. 2016; 48: 1767‑1769. | Crossref
- Behr TM, Feucht HE, Richter K, et al. Detection of humoral rejection in human cardiac allografts by assessing the capillary deposition of complement fragment C4d in endomyocardial biopsies. J Heart Lung Transplant. 1999; 18: 904‑912. | Crossref
- Hammond MEH, Revelo MP, Miller DV, et al. ISHLT pathology antibody mediated rejection score correlates with increased risk of cardiovascular mortality: a retrospective validation analysis. J Heart Lung Transplant. 2016; 35: 320‑325. | Crossref
- Małyszko J. Immune biomarkers: do they impact long‑term graft survival? Pol Arch Intern Med. 2017; 127: 149‑151. | Crossref
- Scheubel RJ, Zorn H, Silber RE, et al. Age‑dependent depression in circulating endothelial progenitor cells in patients undergoing coronary artery bypass grafting. Journal of the American College of Cardiology. 2003; 42: 2073. | Crossref
ARTICLE INFORMATION