Diffusion-weighted magnetic resonance enterocolonography in assessing Crohn disease activity
Key words: apparent diffusion coefficients, Crohn disease, Crohn disease endoscopic index of severity, diffusion-weighted imaging, magnetic resonance activity index


 CC BY-NC-SA 4.0
Diffusion-weighted magnetic resonance enterocolonography in assessing Crohn disease activity
Introduction: Diffusion‑weighted magnetic resonance imaging has the potential to identify inflamed bowel segments in patients with Crohn disease (CD).
Objectives: We aimed to determine diffusion‑weighted imaging (DWI) value to predict active CD and compare apparent diffusion coefficients (ADCs) with endoscopic and conventional indices of magnetic resonance imaging of CD activity.
Patients and methods: Overall, 229 patients with suspected and diagnosed CD prospectively underwent magnetic resonance enterocolonography (MR‑EC) with DWI sequence and ileocolonoscopy. The magnetic resonance activity index (MaRIA), Clermont index, and CD endoscopic index of severity (CDEIS) were calculated.
Results: The clinical diagnosis of CD was confirmed in 100 out of 229 patients. A DWI score of 2 or higher had 96.9% sensitivity and 82.3% specificity for diagnosing CD. A threshold ADC value of 1.3 × 10⁻³ mm2/s could distinguish between normal and inflamed bowel segments with a sensitivity of 73.8% and a specificity of 98%. For the MaRIA, a threshold ADC value of 1.32 × 10⁻³ mm2/s with a sensitivity of 97.9% and a specificity of 97.8% was established. There were significant differences in the DWI scores and ADC values comparing patients with inactive, mild, and moderate‑to‑severe disease (P <0.01). ADCs inversely correlated with the MaRIA global (r = –0.69; P = 0.001), Clermont global (r = –0.722; P = 0.001), and CDEIS (r = –0.69; P = 0.001).
Conclusions: DWI is a valuable tool that is capable of identifying inflamed bowel segments as accurately as the conventional MaRIA score and of discriminating between mild and moderate‑to‑severe CD.
What's new?
The diagnosis of Crohn disease (CD) is based on a combination of endoscopic, histological, radiological, and / or biochemical investigations. Magnetic resonance enterocolonography is of extreme importance in patients with CD. Often used alone, endoscopy is not enough for accurate diagnosis, optimal treatment planning, and prediction of the disease course. Diffusion‑weighted imaging (DWI) is a well‑established and fundamental magnetic resonance sequence in neuroimaging and oncology. Our study showed that DWI could discriminate between mild and moderate‑to‑severe CD, which can be especially helpful in disease monitoring. The apparent diffusion coefficient is also useful in locating actively inflamed bowel segments. With the increasing activity of CD, DWI MR signal intensity increases, and apparent diffusion coefficient values decrease. The DWI sequence does not replace conventional sequences of magnetic resonance enterocolonography but adds additional qualitative and quantitative information. It takes a few minutes to complete the sequence without the need for extra funds for intravenous contrast.
Introduction
Crohn disease (CD) usually affects young adults and can have a progressive and disabling course. Therefore, early diagnosis and monitoring of activity are essential. Endoscopic and histopathological evaluation of CD activity remains a reference standard.1 Therefore, the usefulness of inflammatory markers is increasingly being explored, and the results are promising. Cibor et al2 assessed the tissue factor pathway inhibitor level, which was associated with the clinical activity of CD.
The development of magnetic resonance imaging (MRI) sequences in the last decade has made MRI of the bowel a very attractive diagnostic tool for CD.3 Magnetic resonance enterocolonography (MR‑EC) is a noninvasive imaging modality that complements ileocolonoscopy. The MR‑EC advantages are the absence of ionizing radiation, high soft‑tissue resolution, and unique diffusion‑weighted imaging (DWI) sequence. The DWI creates contrast through the motion of water and other small molecules within tissue,4 which allows qualitative and quantitative functional analysis. The sequence is not time consuming, and the most significant advantage is that no intravenous contrast is needed.4 Different pathological features, such as cell density, extracellular matrix, nucleic areas, and membrane permeability, can be assessed by DWI quantified with the apparent diffusion coefficient (ADC).5,6
The aim of this study was to determine the potential of DWI in the evaluation of patients with CD as a new opportunity to extend MR‑EC capacity by comparing DWI with endoscopic and conventional MRI activity indices.
Patients and methods
A single‑center prospective study was carried out between 2013 and 2018. The study was approved by the Kaunas Regional Biomedical Research Ethics Committee (no. BE‑2‑48, December 21, 2012). All patients signed informed written consent.
Our prospective study enrolled consecutive patients with suspected or already diagnosed CD who were referred for MR‑EC. The inclusion criteria were as follows: adults (>18 years) with clinically suspected or already established CD, complete ileocolonoscopy and MR‑EC examinations with DWI sequence, and performance of MR‑EC within 14 days after ileocolonoscopy. The patients were excluded if they had other intestinal lesions, except Crohn disease, found on MR‑EC and / or endoscopy (tumors, diverticulosis, etc).
A total of 229 patients met the inclusion criteria. One hundred patients fulfilled the Copenhagen Diagnostic Criteria for CD (at least 2 of the criteria).7 The remaining 129 patients in whom no organic lesions were found on endoscopy and MRI served as controls. Blood specimens were taken before the MR‑EC procedure. Ileocolonoscopy with biopsy was performed in all patients 14 days within the MR‑EC examination. The Crohn disease endoscopic index of severity (CDEIS) was used to assess endoscopic disease activity.8 All patients with diagnosed CD were classified according to the Montreal classification.9
The applied MR‑EC protocol included bowel cleaning and pre‑examination fasting overnight. On the examination day, about 1 hour before the examination, each patient was given a 2.5% solution (1500–2000 ml) of mannitol orally. For the inhibition of bowel peristalsis before the MR‑EC, an intravenous injection of 20 mg/ml N‑butyl scopolamine (Buscopan, Boehringer Ingelheim, Germany) was administered. The applied MR‑EC protocol was described in detail elsewhere.10
DWI sequences were acquired before the contrast injection. Free‑breathing axial DWI MRI was performed using an echo‑planar imaging sequence (field of view, 380 mm; repetition time / echo time, 1500/74 ms; slice thickness, 6 mm). Three b values were obtained (50, 400, and 800).
A single dose (0.2 mg/kg) of intravenous gadolinium‑based contrast media (Magnevist Bayer Schering Pharma, Berlin, Germany) was injected into an arm vein at a rate of 3 ml/s, followed by a saline solution (10 ml).
MR‑EC was performed on a 1.5‑Tesla MR unit (Siemens Healthcare GmbH, Erlangen, Germany) using the manufacturer’s phased‑array body coils in the prone position.
MR‑EC images were evaluated on PACS workstation (Syngo.via, Siemens Healthineers).
The bowel was divided into 9 segments.10 The jejunum was considered as segment I, assumed in the left upper quadrant of the abdomen, bowel with a typical feathery fold pattern. The proximal and middle ileum represented segment II, located in the left lower quadrant. The terminal ileum, including the ileocecal junction, represented segment III as 10 cm of the ileum immediately proximal to the ileocecal valve.11
The extent of inflammation of the small bowel and colon in each segment was evaluated for mural wall thickness, mural edema, and contrast enhancement, as well as ulcers, and was described in detail elsewhere.10
On DWI using a b value of 800 s/mm2, the mural signal intensity was graded on a 4‑point scale: 0, normal; 1, probably normal; 2, probably abnormal; and 3, abnormal. The bowel wall was considered normal when the scores were 0 and 1, considered as indicating inflammation of 2 or more scores.
ADC maps were used for the quantitative analysis of DWI data. Two regions of interest were placed manually on the ADC map on the wall of the most abnormal area of the bowel wall (Supplementary material, Figure S1A and S1B) and the other normal looking intestine wall segments without including the bowel content and on the psoas muscle. The mean ADC of these measurements for each patient was calculated.
As a reference standard, the MaRIA—the first validated MRI index for grading CD activity and severity—was used.12,13 The MaRIA was calculated according to the formula by Rimola et al:12 MaRIA = 1.5 × wall thickness (mm) + 0.02 × relative contrast enhancement + 5 × edema + 10 × ulceration.12 The MaRIA Global (MaRIA‑G) was calculated as the sum of all segments of each patient.
The Clermont index was calculated using the formula: −1.321 × ADC (mm2/s) + 1.646 × wall thickening + 8.306 × ulcers + 5.613 × edema + 5.039.14 The Clermont Global (G) was calculated as the sum of all segments of each patient.
Cutoffs for the MaRIA score of more than 7 and the Clermont index of more than 8.4 were used for differentiating active from inactive CD.15
Statistical analysis
Statistical analysis was performed using the SPSS software package for Windows V20.0 (Statistical Package for the Social Sciences, Chicago, Illinois, United States). The Shapiro‑Wilk test was employed to check data normality. If data were found to be normally distributed, they were expressed as means with standard deviations, if nonnormally, as medians with interquartile range. Categorical data were summarized by means of counts and percentages. Nonnormally distributed data were compared using the nonparametric Mann–Whitney and Kruskal–Wallis tests. Categorical data were assessed by the χ2 test. Relationships between parameters were assessed by the Spearman rank correlation analysis.
The strength of correlation was assessed as follows: correlation was considered very weak if 0 <|R| <0.2; weak, if 0.2 <|R| <0.4; moderate, if 0.4 <|R| <0.7; strong, if 0.7 <|R| <0.9; and very strong, if 0.9 <|R| <1.16
Areas under the receiver operating characteristic curve were calculated, cutoff points for best specificity and sensitivity were determined, and accuracy, positive predictive value (PPV), and negative predictive value (NPV) were calculated.
Statistical significance was set at a P value of less than 0.05.
Results
A total of 229 patients were enrolled in the study: 100 patients with confirmed CD diagnosis according to the Copenhagen diagnostic criteria and 129 controls without any visible lesions on endoscopy and MR‑EC. Men accounted for more than half (55 [55%]) of patients with CD (women, 45 [45%]). The mean (range) age of the study population was 36.85 (18–67) years. The control group included 69 (53.48%) men and 60 (46.52%) women with the mean (range) age of 36 (19–69) years. Patients with CD did not differ from controls regarding age and sex (P >0.05).
The median (range) disease duration for CD patients was 1 (1–4) year. Disease location was mostly ileal (49 [49%]). Nonstricturing, nonpenetrating disease prevailed (54 [54%]). Clinical data of patients with CD are presented in Table 1.
Characteristics | Value |
Data are presented as number (percentage) of patients unless otherwise indicated.
Abbreviations: CD, Crohn disease; IQR, interquartile range; MaRIA, Magnetic Resonance Index of Activity | |
Disease duration at inclusion, y, median (IQR) | 1 (1–4) |
Age at diagnosis | |
A1, below 16 years | 2 (2) |
A2, between 17 and 40 years | 66 (66) |
A3, above 40 years | 32 (32) |
Disease location | |
L1, ileal | 49 (49) |
L2, colonic | 15 (15) |
L3, ileocolonic | 36 (36) |
Disease behavior | |
B1, nonstricturing, nonpenetrating | 54 (54) |
B2, stricturing | 20 (20) |
B3, penetrating | 26 (26) |
Active disease CD (MaRIA >7) | |
No | 48 (48) |
Yes | 52 (52) |
Active disease CD (Clermont >8.4) | |
No | 48 (48) |
Yes | 52 (52) |
The mean (SD) measurements of bowel wall ADC values were as follows: ADC values of the inflamed bowel wall were significantly lower (1.086 [0.09]) × 10–3 mm2/s as compared with normal bowel wall (1.623 [0.097]) × 10–3 mm2/s and the psoas muscle (1.46 [0.07]) × 10–3 mm2/s (P <0.001). ADC distribution is shown in Figure 1.
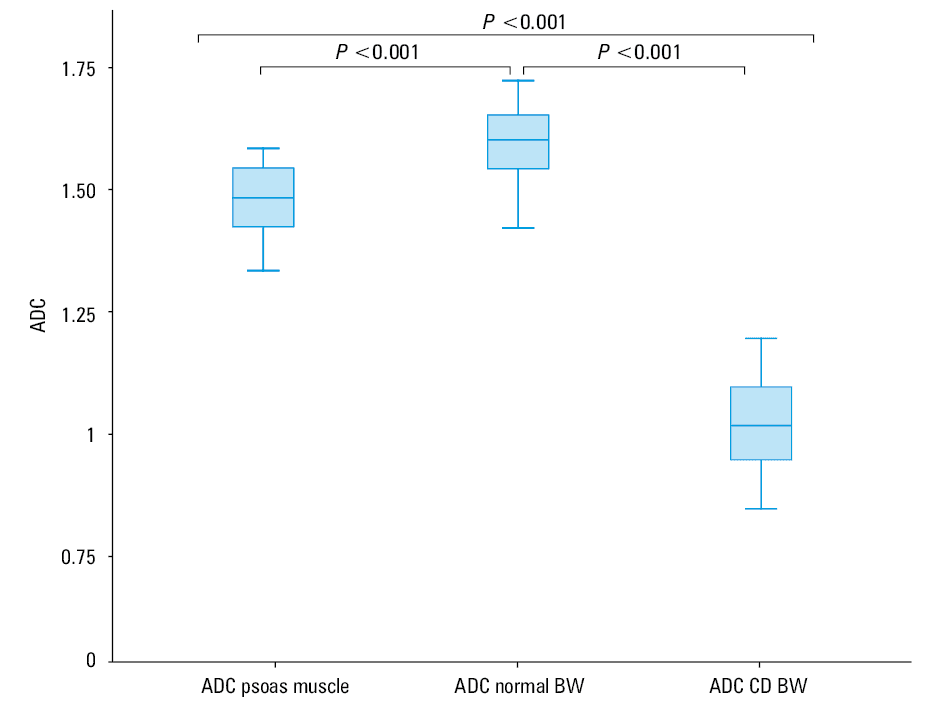
When comparing the inflamed segments of the terminal ileum (n = 51) and the colon (n = 47), there were no differences in the mean (SD) ADC values (1.074 [0.09] × 10–3 mm2/s and 1.098 [0.08] × 10–3 mm2/s, respectively; P >0.05).
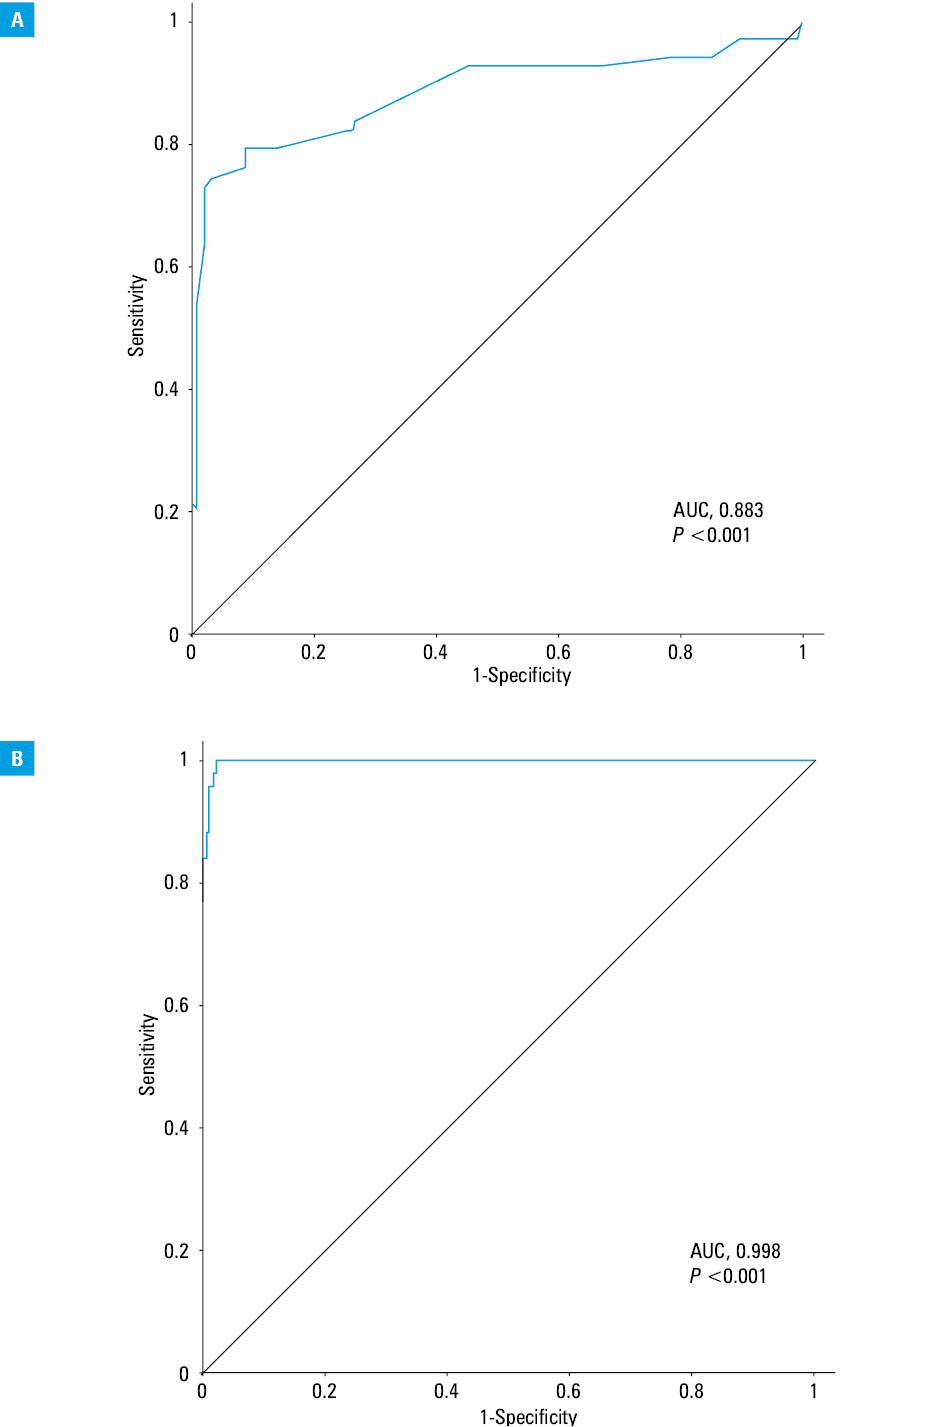
The ADC cutoff value of 1.30 × 10⁻³ mm2/s detected by the peak of the ROC curve yielded a sensitivity of 73.8%, specificity of 98%, PPV of 94.7%, and NPV of 88.4% for predicting CD using the Copenhagen diagnostic criteria as a reference standard (Figure 2A).
Abbreviations: AUC, area under the curve
The threshold ADC value of 1.32 × 10⁻³ mm2/s by using the MaRIA as a reference standard had a sensitivity of 97.9%, specificity of 97.8%, PPV of 92.2%, and NPV of 99.4% for predicting CD (Figure 2B).
A DWI score of 2 or more had a sensitivity of 96.9%, specificity of 82.3%, PPV of 82.6%, and NPV of 96.4% for diagnosing CD.
As assessed by endoscopy, 20 patients (20%) had inactive disease (CDEIS <3), 59 (59%) had mild disease (CDEIS, 3–8), and 21 (21%) had moderate‑to‑severe disease (CDEIS ≥9).
The DWI scores and ADC values corresponding to different CD activity scores, according to the CDEIS, were summarized in Table 2. With the increasing activity of CD, a significant increase in the DWI signal intensity score was observed, and the ADC values decreased. There were differences in the DWI scores and ADC values comparing patients with inactive, mild, moderate‑to‑severe disease (P <0.01).
Parameter | Inactive CDa (n = 20) | Mild CDb (n = 59) | Moderate‑to-
-severe CDc (n = 21) | P value |
a Crohn disease endoscopic index of severity <3
b Crohn disease endoscopic index of severity of 3–8
c Crohn disease endoscopic index of severity ≥9
d Kruskal–Wallis test
e ANOVA test
Abbreviations: ADC, apparent diffusion coefficient; CD, Crohn disease; DWI, diffusion‑weighted imaging; IQR, interquartile range; others, see Table 1 | ||||
DWI hyperintensity, median (IQR) | 0 (0–2) | 2 (0–3) | 3 (2–3) | <0.01d |
ADC, mean (SD) | 1.42 (0.19) | 1.12 (0.26) | 0.96 (0.07) | <0.01e |
According to the MaRIA score, 48 patients (48%) had inactive CD (MaRIA <7); 5 (5%) had active disease (MaRIA 7–11); and 47 (47%) had severe disease (CDEIS ≥11).
The DWI scores and ADC values corresponding to different CD activity scores in accordance with MaRIA are shown in Table 3. With the increasing activity and severity of CD, the DWI signal intensity increased, while the ADC values decreased. There were differences in the DWI scores and ADC values among patients with inactive, active, and severe disease (P <0.001).
Parameter | Inactive CDa (n = 48) | Active CDb (n = 5) | Severe CDc (n = 47) | P value |
a Magnetic resonance index of activity <7
b Magnetic resonance index of activity of 7–11
c Magnetic resonance index of activity ≥11
d Kruskal–Wallis test
e Analysis of variance (ANOVA) test
| ||||
DWI hyperintensity, median (IQR) | 0 (0) | 2 (1–2) | 3 (2–3) | <0.001d |
ADC, mean (SD) | 1.49 (0.09) | 1.11 (0.03) | 0.97 (0.1) | <0.001e |
The ADC values correlated similarly with the Clermont‑G index (R = –0.722; P = 0.001) and the MaRIA‑G (R = –0.69; P = 0.001) (Table 4). Also, a very strong correlation was established between the Clermont‑G and MaRIA‑G score (R = 0.97; P = 0.001). The significant correlation between the Clermont index and the endoscopic disease activity index CDEIS was found (R = 0.795; P = 0.001). The MaRIA also correlated significantly with the CDEIS (R = 0.754; P = 0.001), respectively. The CDEIS was inversely correlated with ADC (R = –0.69; P = 0.001).
Parameter | MaRIA‑G | Clermont‑G | CDEIS |
a P = 0.001
Abbreviations: CDEIS, Crohn disease endoscopic index of severity, MaRIA‑G, magnetic resonance index of activity global; others, see Table 2 | |||
ADC |
|
|
|
Discussion
Although MR‑EC has become a standard diagnostic tool for Crohn disease, the use of DWI value for grading of inflammation is still controversial. Our data demonstrated that DWI could quite accurately distinguish a healthy bowel from an inflamed one. Moreover, in our series, DWI could discriminate between mild and moderate‑to‑severe CD, which may particularly aid in disease monitoring.
The ADC values of the inflamed bowel wall were lower than the values of the normal bowel wall and the psoas muscle in our study. With the increasing activity of CD, DWI MR imaging signal intensities increased and ADC values decreased.
The mean (SD) ADC of 1.086 (0.09) × 10–3 mm2/s in the inflamed bowel wall in our study was slightly lower compared to the 1.28 (0.47) × 10–3mm2/s reported by Li et al17, and 1.2 × 10⁻³ mm2/s reported by Neubauer et al,18 but much lower than in the studies by Oto et al19 and Pendse et al.20 Differences in the ADC among studies may be related to the different samples and scan parameters, including the b values. In our study, 3 b values of 50, 400, and 800 s/mm2 were used, while Seo et al21 employed 2 b values 0 and 900 s/mm2 and Oto et al19 also used 2 b values, 0 and 600 s/mm2.
Our study included patients with CD and controls who underwent both MR‑EC and ileocolonoscopy during the short period. We have found a significant correlation between MR‑EC findings and endoscopic disease activity assessed by CDEIS. The study by Li et al17 reported that DWI could distinguish inflamed segments from normal segments with similar diagnostic accuracy as conventional MRE. Another study by Seo et al21 showed similar abilities of DWI and contrast‑enhanced MRI to detect terminal ileitis. Analyzing abnormal DWI signal intensity, we found high sensitivity and specificity (96.9% and 82.3%, respectively) for diagnosing CD. Our results are in line with some other previously published studies.14,22-24
The ultimate threshold value for ADC capable of distinguishing active from inactive CD has not been established yet. The ability to calculate quantitative parameters such as ADC may lead to a more objective evaluation of the disease.22 We calculated the optimal cutoff ADC value for predicting CD using Copenhagen diagnostic criteria and the MaRIA as the reference standards. Both ADC values were alike, 1.30 × 10⁻³ mm2/s and 1.32 × 10⁻³ mm2/s, respectively. Khalek et al24 found ADC values of 1.21 (0.42) × 10−3 mm2/s for the active disease. Rimola et al25 found the best ADC cutoff for predicting activity 1.368 × 10⁻³ mm2/s and another best cutoff for severe disease 1.293 × 10⁻³ mm2/s. Our study was focused on finding the best DWI values for predicting CD as a clinical diagnosis, while Rimola et al13 used ADC cutoffs for the detection of ulcers.
The present study investigated whether a DWI signal is capable of distinguishing inactive, mild, and moderate‑to‑severe CD as defined by the CDEIS and revealed associations for inactive, mild, and moderate‑to‑severe disease activity. Similar results demonstrated by Li et al26 confirmed that DWI could grade CD activity when compared to endoscopy as the reference standard. Kim et al27 showed that positive DWI findings in the bowel were associated with a higher CDEIS score. Our study demonstrated similar interconnection with CDEIS and DWI signal and ADC. Higher DWI signal intensities were associated with lower ADC values and elevated CDEIS scores. Lower ADC values and higher DWI signal scores were reported more frequently with higher degrees of bowel inflammation.20,26
Another important aspect to consider is that we found the MaRIA and ADC associations for grading inactive, active, and severe disease. Our study showed that it is possible to grade inflammatory activity in patients with CD by evaluation ADC values.
We also attempted to evaluate the ADC correlation with other well‑known MRI indices. We found a strong inverse ADC correlation with the MaRIA and Clermont indices. Moreover, an excellent relationship was found between the endoscopic index, CDEIS, with ADC derivate, the Clermont index.
The strength of our study is the prospective design and complete ileocolonoscopy performed in all patients. Out of 229 patients included in the study, 100 had a precisely diagnosed CD according to the Copenhagen criteria. The study by Hordonneau et al28 included a total of 130 patients who underwent only MR‑EC investigation without endoscopy. Other available studies were either retrospective or included a small number of patients.
The limitation of the investigation might be that our study was carried out in a single center and did not include a follow‑up period.
Our study showed that DWI and ADC significantly correlated with other MRI indices as well as CDEIS and can be used for measuring CD activity and distinguishing inflamed segments of the bowel wall from normal ones. Also, DWI is able to discriminate between mild, moderate, and severe CD activity.
- Eder P, Katulska K, Łykowska‑Szuber L, et al. Simple Enterographic Activity Score for Crohn’s Disease: comparison with endoscopic, biochemical, and clinical findings. Pol Arch Med Wewn. 2013; 123: 378‑385. | Crossref
- Cibor D, Szczeklik K, Mach T, Owczarek D. Levels of tissue factor pathway inhibitor in patients with inflammatory bowel disease. Pol Arch Intern Med. 2019; 129: 253‑258.
- Gee MS, Harisinghani MG. MRI in patients with inflammatory bowel disease. J Magn Reson Imaging. 2011; 33: 527‑534. | Crossref
- Pita I, Magro F. Advanced imaging techniques for small bowel Crohn’s disease: what does the future hold? Therap Adv Gastroenterol. 2018; 11: 1‑15. | Crossref
- Xu J, Does MD, Gore JC. Sensitivity of MR diffusion measurements to variations in intracellular structure: effects of nuclear size. Magn Reson Med. 2009; 61: 828‑833. | Crossref
SUPPLEMENTARY MATERIAL
ARTICLE INFORMATION