Long-term prognostic scores may underestimate the risk of death in patients with heart failure with reduced ejection fraction in whom red cell distribution width is elevated
Key words: anisocytosis, heart failure, Meta-Analysis Global Group in Chronic Heart Failure Score, red blood cell distribution width, Seattle Heart Failure Survival Model


 CC BY-NC-SA 4.0
Long-term prognostic scores may underestimate the risk of death in patients with heart failure with reduced ejection fraction in whom red cell distribution width is elevated
Introduction: Risk prediction in patients with heart failure with reduced ejection fraction (HFrEF) is one of the key challenges for clinicians. Novel biomarkers aggregating several important pathophysiological pathways may modify the diagnostic discrimination of validated scores. The red cell distribution width (RDW) is a cheap and easily available measure of anisocytosis, and was shown to have a strong independent prognostic power in short- and medium‑term prognosis in HFrEF.
Objectives: Our aim was to assess the prognostic power of RDW in optimally treated chronic HFrEF, and to investigate whether different RDW may impact the prognostic accuracy of validated long‑term scores in HFrEF.
Patients and methods: The study included 551 patients at a median (interquartile range [IQR]) age of 54 (47–59) years, of whom 86.6% were men. The patients represented the median New York Heart Association class III (IQR, II–III), and ischemic etiology occurred in 56.6% of the cases. In all patients, RDW as a coefficient of variation was calculated, along with Meta‑Analysis Global Group in Chronic Heart Failure Score (MAGGIC‑HF) and Seattle Heart Failure Survival Model (SHFSM).
Results: The patients were followed for 5 years and all‑cause mortality was assessed. We recorded 166 (30.1%) and 225 (40.8%) deaths at 3 and 5 years, respectively. Scores based on MAGGIC‑HF and SHFSM algorithms for the respective prediction of 3- and 5‑year mortality were calculated for each patient and compared with the observed mortality. There was a significant underestimation of mortality in the patients with RDW above 15.4% (reference values, 11.5%–14.5%), while in those with lower RDW SHFSM overestimated the actual risk. The excess mortality in the higher RDW group was confirmed by the Hosmer–Lemeshow statistic.
Conclusions: The RDW has a strong prognostic value in chronic HFrEF, independently of the risk assessed by the MAGGIC‑HF or the SHFSM score.
What's new?
In certain clinical situations where red cell distribution width (RDW) is elevated, the estimation of mortality risk by popular and validated risk scores, such as Meta‑Analysis Global Group in Chronic Heart Failure Score and the Seattle Heart Failure Survival Model may be significantly underestimated. Given the fact that a considerable percentage of patients with chronic heart failure with reduced ejection fraction may have elevated values of this marker, and that this elevation carries information on high risk uncaptured by the risk scores, our observation may be relevant for practicing clinicians. Additionally, low cost and widespread availability of RDW measurement in popular hematologic analyzers make our findings of particular practical utility.
Introduction
Heart failure (HF) has become an epidemic worldwide. The most recent estimation of the global prevalence shows an intimidating number of at least 64 million affected.1 Some authors report that in Poland the number of patients living with HF is likely to be around 2 million or even more.2,3 According to the National Health Fund data posted on the Ministry of Health website, the number is likely to be around 1.2 million people.4
Despite advances in treatment strategies and reduction of mortality risk by up to 70% shown in clinical trials,5 implementation of modern therapies in real life remains unsatisfactory, and mortality is still high.6,7
Apart from better implementation of contemporary guidelines, more accurate prediction of individual clinical trajectory of HF is a key factor. Effective prediction of the short- and long‑term clinical trajectory and outcome could allow for better allocation of resources and more personalized medical care in a timely manner.8,9 Prediction of short- and long‑term individual trajectory is not an easy task and strategies based on clinical profile and biomarkers have been proposed.8,10 Prognostic scores for the short- to long‑term prognosis in both acute and chronic HF have been developed.11-14 To date, more than 200 various prognostic scores in HF have been published.15 However, neither is ideal and their performance and clinical use are lower than expected.16 Among the potential reasons for their limited popularity may be poor calibration in a given population with a resulting reduction in the prognostic performance. Another important issue may be the complexity of most prognostic models. For example, the 2 most extensively validated and accurate scores, such as Meta‑Analysis Global Group in Chronic Heart Failure (MAGGIC‑HF) and Seattle Heart Failure Survival Model (SHFSM) need as many as 13 and 14 parameters, respectively, for their calculation.12
Recently, the use of biomarkers that aggregate many pathophysiological pathways associated with HF has attracted more attention. The new biomarkers have increased hope for reduction of complexity and better calibration of the existing scores / measures. The red cell distribution width (RDW), which is the measure of variation of the dimension and shape of red cells, previously known as anisocytosis, is one of such biomarkers. RDW is a cheap and easily available measure of erythrocyte heterogeneity. It has been shown to reflect higher degree of neuroactivation, inflammation, kidney dysfunction, accelerated aging of tissues, oxidative stress, or multiply nutritional deficits including iron,17 which are all pathways recognized as important contributors to poor prognosis in HF. Furthermore, this biomarker has been shown to be a powerful predictor of poor prognosis in several multiorgan pathologies, including HF.18 The prognostic performance of RDW was extensively tested in acute, advanced, and, to a lesser extent, chronic HF, and was shown to be a useful and strong predictor of death. However, relatively little is known about the association between higher RDW and the prognostic performance of the scores that predict long‑term outcomes in chronic HF. As the most popular risk scores, such as the MAGGIC‑HF and the SHFSM allow for the estimation of death probability in 3- to 5‑year follow‑up, it seems interesting to assess whether these scores perform equally well across a wide spectrum of RDW in optimally treated patients with HF.
Our study had 2 main aims. The first one was to compare the ability of RDW to discriminate between all‑cause mortality or survival in the patients with chronic stable HFrEF in long‑term follow‑up of 3 to 5 years. Secondly, we intended to find out whether the MAGGIC‑HF score and the SHFSM perform equally well in the full spectrum of RDW coefficient of variation (CV) in chronic HFrEF.
Patients and methods
Study group
Data from the university hospital Silesian Center for Heart Diseases in Zabrze were collected in the Prospective Registry of Heart Failure between 2004 and 2015. For the current study, we have selected patients according to the criteria shown below. We included patients aged above 18 years, with chronic HFrEF and reduced left ventricular ejection fraction (LVEF) of maximum 40%, diagnosed according to the criteria of the European Society of Cardiology and with HF duration of more than 6 months. The participants had to be in clinically stable chronic phase of the disease, treated in accordance with the contemporary guidelines, and receive the best tolerated medical therapy. Based on the medical history, the date of HFrEF onset was established to calculate HFrEF duration. Using medical records, we determined the highest body weight within a year before the development of HFrEF, taken as the pre‑HF body weight. When multiple measurements were available in individual patients, the mean value was taken as the pre‑HF body weight. We included patients in whom RDW values expressed as the CV, as well as prognostic scores of 3- and 5‑year mortality risk, calculated using the MAGGIC‑HF or SHFSM algorithm, were available in our database.
We excluded the patients treated with glucocorticosteroids, those having active infections, liver disease with enzyme levels 4 times higher than reference values (reference values: alanine transaminase, 4–36 IU/l; aspartate transferase, 5–30 IU/l; alkaline phosphatase, 40–129 IU/l; γ-glutamyl transpeptidase, 6–50 IU/l), active bleeding, known neoplasm, or undergoing renal replacement therapy. Also, the patients in whom body mass before the onset of chronic HFrEF could not be reliably established were not included.
Out of 1168 registry participants, 551 fulfilled the study criteria. The remaining patients were excluded from the study because their RDW‑CV values and / or prognostic scores were not available. However, they were similar to the study group in terms of mean age, the proportion of women, New York Heart Association (NYHA) class, etiology of HF, EF, natriuretic peptides levels, and even mortality risk. Blood samples were drawn in a standardized manner in the morning, between 8 AM and 10 AM, from the patients fasting for at least 8 hours and resting for 30 minutes in a supine position in a quiet, environmentally‑controlled room. The blood was immediately centrifuged at 4 ºC and stored at –75 ºC for further analyses. All procedures were undertaken in accordance with the Helsinki Declaration. The study protocol was reviewed and accepted by the Ethics Committee of the Medical University of Silesia in Katowice (NN‑6501‑12/I/04). All patients expressed their informed, written consent.
Study procedures
Body mass and height were measured on the index date using a certified scale (Radwag, Radom, Poland). Body mass index (BMI) was calculated by dividing the weight in kilograms by height in meters squared and presented as pre‑HF BMI and index BMI, respectively. The percent weight loss was calculated using the following equation:
Weight loss [%] = 100 × (pre‑HF BMI – index BMI) / pre‑HF BMI.
The Sonos‑5000 Hewlett‑Packard ultrasound scanner (Hewlett‑Packard, Andover, Massachusetts, United States) was used to measure LVEF from the apical 4‑chamber view. LVEF was calculated according to the following formula:
LVEF = [(end‑diastolic volume – end‑systolic volume) / end‑diastolic volume] × 100.
Commercially available reagents and diagnostic machines (Roche Diagnostics, Basel, Switzerland) were used to measure hemoglobin, mean corpuscular volume (MCV) of erythrocytes, serum creatinine, N‑terminal pro–B‑type natriuretic peptide (NT‑proBNP), serum sodium, uric acid, total cholesterol, and high‑sensitivity C‑reactive protein (hs‑CRP). Based on creatinine measurements, we calculated estimated glomerular filtration rate (eGFR) with the equation from the Modification of Diet in Renal Disease (MDRD) formula:
eGFRMDRD = 186 × plasma creatinine [mg/dl]–1.154 × age [years]–0.203 × 0.742 (if female).
RDW was shown as a CV and calculated by dividing SD of the mean cell size by the MCV of erythrocytes and multiplied by 100 to convert to percentages:
RDW‑CV = 100 × SD of distribution curve at 20% of its height / MCV of erythrocytes.
The RDW‑CV values were provided by a Roche Hematology analyzer (Roche, Boston, Massachusetts, United States). The patients were followed for 5 years and all‑cause mortality data at 3- and at 5‑years were obtained and confirmed in the National Database of Citizens in Warsaw.
Statistical analysis
Categorical variables are presented as numbers and percentages. Normally distributed continuous variables are presented as mean values and SD, whereas non‑normally distributed data are presented as medians and interquartile ranges (IQRs). Normality of the distribution was checked by the Shapiro–Wilk test. Statistical significance of the between‑group comparison was assessed by means of the χ2 test for categorical variables, the t test was used for normally distributed continuous variables, and the Mann–Whitney test was used for non‑normally distributed continuous variables.
In the first step, we checked the goodness of fit of either MAGGIC‑HF and later on SHFSM‑based estimations of death risk with true mortality rates observed in our cohort. We divided the whole cohort into deciles of MAGGIC‑HF 3‑year probability of death, and then into deciles of SHFSM‑based estimation of 5‑year probability of death. In the next step, we drew the plot of estimated vs observed mortality in ascending deciles of MAGGIC‑HF (Supplementary material, Figure S1) or SHFSM (Supplementary material, Figure S2), and applied the Hosmer–Lemeshow statistic to see if there was sufficient calibration of the risk scores.
Afterwards, we identified the RDW‑CV value optimally discriminating the patients who died from those alive at 3 years and then at 5 years. We used the receiver operating characteristics (ROC) and the Youden method to find the discriminating cutoffs. Then, we constructed the Kaplan–Meier survival curves to show the difference in the mortality risk between the 2 RDW‑CV groups identified based on the ROC analysis. The log‑rank test was used for comparison.
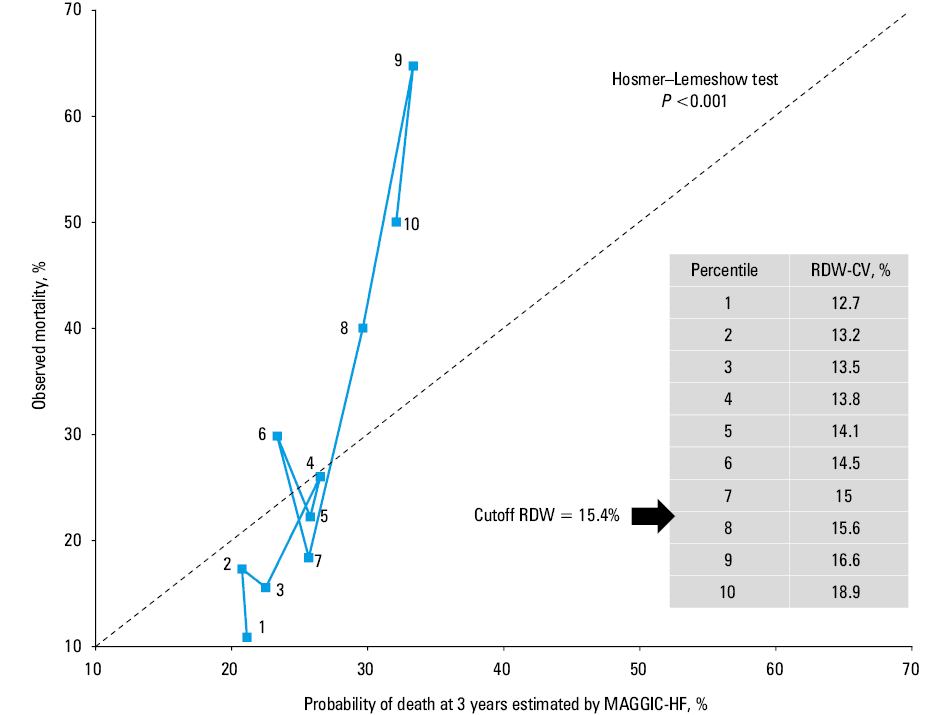
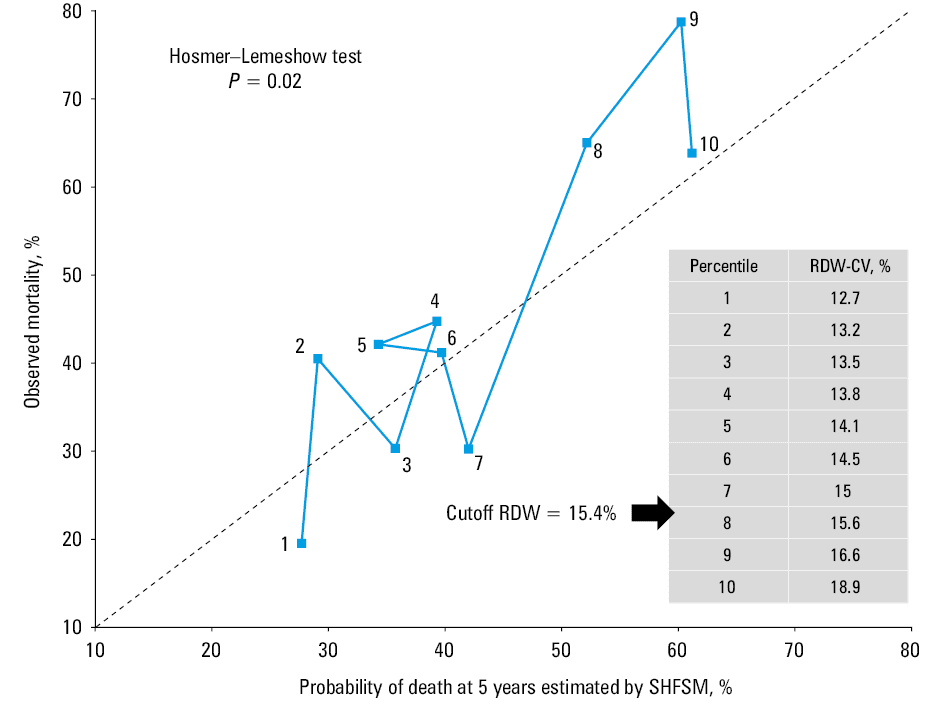
In the next step, in an attempt to clarify whether the difference between the estimated and observed mortality risk depended on RDW‑CV, we split the RDW‑CV values into deciles. Next, we plotted mean estimated vs mean observed mortality values at consecutive deciles of RDW‑CV. The Hosmer–Lemeshow statistic was used to show whether the expected mortality rate matched the observed one within the RDW‑CV deciles. We performed the same analysis for the MAGGIC‑HF and for the SHFSM, separately.
Finally, we used the logistic regression analysis with mortality at 3 and then at 5 years taken as a dependent variable to show whether the MAGGIC‑HF or SHFSM scores retained their prognostic power after adjustment for RDW‑CV.
For all analyses, the significance level was set at a P value below 0.05 (2‑tailed), and all calculations were performed using the software packages of Statistica v.13 (Statsoft, Kraków, Poland) and SAS version 9.4 software (SAS Institute Inc., Cary, North Carolina, United States).
Results
The study included 551 patients at af mean (SD) age of 52 (11) years, of whom 86.6% were men. They represented the median NYHA class III (IQR, II–III), and ischemic etiology occurred in 56.6% of the cases. Within the follow‑up of 3 and 5 years, 166 (30.1%) and 225 (40.8%) patients died, respectively.
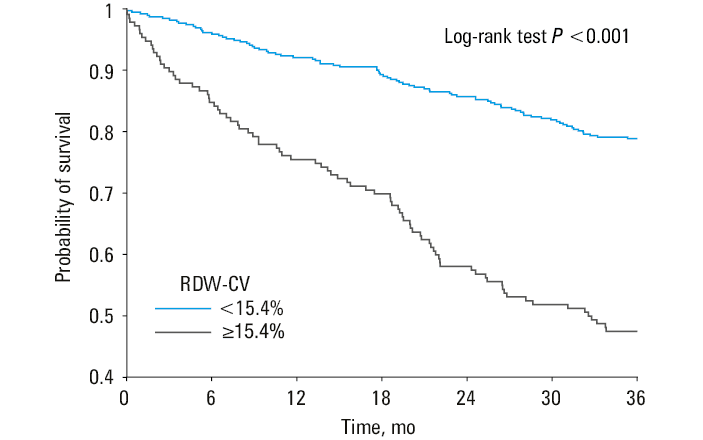
In the ROC analysis, the RDW significantly discriminated the patients who died from those alive in both 3- and 5‑year follow‑up. In these analyses, the Youden method allowed for identification of the same optimal discriminating value of RDW‑CV equal to 15.4% (Supplementary material, Figure S3). For the 3‑year follow‑up, the area under curve (AUC) was 0.682 (95% CI, 0.663–0.731; P <0.001), and for the 5‑year follow‑up the AUC was 0.652 (95% CI, 0.605–0.698; P <0.001).
When we split the whole cohort according to the RDW‑CV cutoff, 391 (71%) patients fell into the lower RDW‑CV group, while 160 (29%) individuals had higher RDW‑CV values. In the patients with elevated RDW‑CV, the duration of chronic HFrEF was longer, they lost more weight, which resulted in a lower index BMI, and their symptoms were more advanced. This was evidenced by a higher proportion of patients in the NYHA class III or IV, lower oxygen consumption during exercise, as well as lower blood pressure and EF.
Together with the clinical profile, the laboratory findings also suggested a more advanced stage of chronic HFrEF in the patients with elevated RDW‑CV. Their hemoglobin, MCV, serum cholesterol, eGFR, and sodium levels were lower, while NT‑proBNP and hs‑CRP concentrations were higher.
The prevalence of comorbidities was similar in both groups, but treatment differed significantly. In the patients belonging to the higher RDW‑CV group, angiotensin‑converting enzyme inhibitors (ACEIs) and angiotensin receptor blockers (ARBs) were administered less frequently, while mineralocorticoid receptor antagonists (MRAs) and diuretics were prescribed more often. Moreover, the dosages of key drugs, such as ACEI/ARB and β-blockers (BBs) were lower, but those of MRAs and diuretics were higher (Table 1).
Parameter | Subgroups according to red cell distribution width | P value | ||
All patients (n = 551) | RDW <15.4% (n = 391) | RDW ≥15.4% (n = 160) | ||
Data are presented as number (percentage) or median (interquartile range) unless indicated otherwise.
a Tested with the t test
SI conversion factors: to convert creatinine to µmol/l, multiply by 88.4; hemoglobin to g/l, by 10; hs‑CRP to mg/l, by 10; NT‑proBNP to ng/l, by 1.
Abbreviations: BMI, body mass index; BP, glood pressure; eGFRMDRD, glomerular filtration rate estimated based on the equation from the Modification of Diet in Renal Disease Trial; hs‑CRP, high‑sensitivity C‑reactive protein; HF, heart failure; ICM, ischemic etiology of HF; LVEF, left ventricular ejection fraction; MCV, mean corpuscular volume; MVO2, maximal oxygen consumption on symptom‑limited treadmill exercise test; NT‑proBNP, N‑terminal pro–B‑type natriuretic peptide; NYHA, New York Heart Association; RDW, red cell distribution width | ||||
Baseline demographics and functional tests | ||||
Age, y | 54 (47–59) | 54 (46–58) | 55 (48–59) | 0.17 |
Male sex, % | 86.6 | 85.7 | 88.8 | 0.34 |
HF etiology – ICM, % | 56.6 | 57.3 | 55 | 0.62 |
NYHA class | III (II–III) | III (II–III) | III (III–III) | <0.001 |
NYHA class I, % | 7.8 | 9.5 | 3.8 | <0.001 |
NYHA class II, % | 31.2 | 39.9 | 10 | <0.001 |
NYHA class III, % | 49.7 | 43.7 | 64.4 | <0.001 |
NYHA class IV, % | 11.3 | 6.9 | 21.9 | <0.001 |
BMI, kg/m2 | 26.1 (23.2–29.1) | 26.5 (23.7–29.6) | 24.8 (21.7–27.9) | 0.001 |
Weight loss from pre‑HF, BMI till index BMI, % | 6.3 (0–13.3) | 4.7 (–1.4 to 11.2) | 10.9 (4.5–17.6) | <0.001 |
Duration of HF, mo | 32 (14–70) | 29 (11–67) | 41 (18–79) | 0.004 |
Systolic BP, mm Hg | 110 (95–120) | 110 (100–120) | 100 (90–110) | <0.001 |
MVO2, ml/min/kg | 14.3 (11.7–17.8) | 15.1 (12.1–18.8) | 12.4 (10.4–15.5) | <0.001 |
LVEF, % | 24 (20–30) | 25 (20–30) | 20 (17–25) | <0.001 |
Laboratory values | ||||
Hemoglobin, mmol/l | 8.8 (8.1–9.5) | 8.8 (8.2–9.5) | 8.5 (7.9–9.5) | 0.02 |
Erythrocytes, 1012/la | 4.65 (0.58) | 4.60 (0.54) | 4.77 (0.67) | 0.002 |
MCV, fla | 90.8 (5.8) | 91.7 (5.1) | 88.4 (6.6) | <0.001 |
Lymphocytes, 103/la | 1.81 (0.6) | 1.75 (0.64) | 1.83 (0.59) | 0.21 |
NT‑proBNP, pg/ml | 1432 (632–3112) | 1026 (468–2030) | 3107 (1654–5923) | <0.001 |
Cholesterol, mmol/la | 4.38 (1.17) | 4.47 (1.14) | 4.16 (1.2) | 0.005 |
Creatinine, mg/dl | 0.98 (0.82–1.19) | 0.94 (0.81–1.14) | 1.07 (0.9–1.33) | <0.001 |
eGFRMDRD, ml/min/1.73 m2 | 87 (68–104) | 89.8 (71–107) | 77 (59–96) | <0.001 |
Uric acid, mg/l | 408 (331–508) | 402 (331–491) | 422 (330–530) | 0.12 |
Sodium, mmol/l | 136 (134–138) | 137 (134–138) | 135 (132–138) | <0.001 |
hs‑CRP, mg/dl | 3 (1.3–6.7) | 2.6 (1.2–5.4) | 5.2 (1.9–11.8) | <0.001 |
As expected based on the clinical profiles of patients with higher vs lower RDW‑CV, the mortality rates estimated by the MAGGIC‑HF and SHFSM were higher for both 3- and 5‑year follow‑up. The higher death risk in the group with elevated RDW was confirmed by true mortality rates (Table 2) and cumulative survival curves from the Kaplan–Meier analysis shown in Figure 1.
Parameter | Subgroups according to red cell distribution width | P value | ||
All patients (n = 551) | RDW <15.4% (n = 391) | RDW ≥15.4% (n = 160) | ||
Data are presented as median (interquartile range) unless indicated otherwise.
Abbreviations: ACEI, angiotensin‑converting enzyme inhibitor; ARB, angiotensin receptor blocker; BB, β-blocker; eq, equivalent; MAGGIC‑HF, Meta‑Analysis of Global Group in Heart Failure; MRA, mineralocorticoid receptor antagonist; SHFSM, Seattle Heart Failure Survival Model; others, see Table 1 | ||||
Comorbidities | ||||
Hypertension, % | 52.1 | 51.7 | 53.1 | 0.76 |
Type 2 diabetes mellitus, % | 28.7 | 27.4 | 31.9 | 0.29 |
Hypercholesterolemia, % | 56.4 | 57.3 | 54.4 | 0.53 |
Hypertriglycerydemia, % | 39.2 | 38.9 | 40 | 0.81 |
History of smoking, % | 76.6 | 77 | 75.6 | 0.73 |
Therapy | ||||
ACEI / ARB, % treated | 91.3 | 92.8 | 87.5 | 0.04 |
ACEI / ARB, % of the recommended dose | 50 (20–100) | 50 (25–100) | 33 (13–63) | 0.001 |
BB, % treated | 95.8 | 95.9 | 95.6 | 0.88 |
BB, % of the recommended dose | 50 (33–67) | 50 (33–67) | 33 (25–67) | 0.02 |
MRA, % treated | 90.7 | 89.5 | 93.8 | 0.12 |
MRA, % of the recommended dose | 100 (100–100) | 100 (50–100) | 100 (100–200) | 0.001 |
Loop diuretics, % treated / mg of furosemide eq. | 84.8 | 81.6 | 92.5 | 0.001 |
Loop diuretics, mg of furosemide eq. | 80 (60–125) | 80 (40–120) | 120 (80–160) | <0.001 |
Mortality prediction and observed outcome | ||||
MAGGIC‑HF prediction at 3 years, % (95% CI) | 26.1 (25.1–27.1) | 23.8 (22.8–24.8) | 31.8 (29.7–33.8) | <0.001 |
True mortality at 3 years, % | 30.1 | 21 | 52.5 | <0.001 |
Ratio of estimated by MAGGIC‑HF to observed | 0.87 | 1.13 | 0.61 | <0.001 |
SHFSM prediction at 5 years, % (95% CI) | 57.3 (55–59.5) | 64.1 (61.9–66.4) | 41.6 (37.6–45.5) | <0.001 |
True mortality at 5 years, % | 40.8 | 30.9 | 65 | <0.001 |
Ratio of estimated by SHFSM to observed | 1.4 | 2.07 | 0.64 | <0.001 |
However, in the patients with RDW‑CV equal to or above 15.4%, the 3‑year and 5‑year risk predictions based on the MAGGIC‑HF or SHFSM were 39% and 36%, respectively, that is, lower than the observed mortality (Table 2). True mortality values were outside of the 95% CIs for the estimated mortality. Predicted mortality based on the MAGGIC‑HF and SHFSM was displayed along with the 95% CIs, and we used these ranges to infer significant differences. This means that these differences were significant at P value below 0.05. These discrepancies could not be explained by poor calibration, because P values in the Hosmer–Lemeshow analyses of calibration of the MAGGIC‑HF and SHFSM were 0.09 and 0.11, respectively (Supplementary material, Figures S1 and S2).
Contrary to the previous group, in the patients with lower RDW‑CV, both the MAGGIC‑HF and SHFSM overestimated the risk. In the case of the MAGGIC‑HF score, there was only a small 13% overestimation, while the SHFSM overestimated the risk by 107%. Both values were significant when judged using 95% CIs for the risk estimation.
To confirm these results, we estimated goodness of fit of the estimated mortality data in ascending deciles of RDW as an explanatory variable for discordance between the estimated and observed mortality (Figures 2 and 3). The visual inspection of mortality discordance plot showed large variations in this discordance with no clear trend at lower levels of RDW‑CV, but clearer underestimation at RDW‑CV values above the cutoff of 15.4%. This was particularly evident in the case of the MAGGIC‑HF (Figures 2 and 3).
Logistic regression analysis showed that both the MAGGIC‑HF and SHFSM remained significant predictors of death risk after adjustment for RDW‑CV. However, in each case, the odds of death were slightly attenuated, particularly when RDW‑CV was used as a categorial variable.
In all of these analyses, RDW‑CV was also a significant predictor of mortality. When the RDW‑CV expressed as a continuous variable was adjusted for the MAGGIC‑HF score, for each 1 SD increment in RDW‑CV, the risk increased by 53% (95% CI, 27%–96%; P <0.001). When we used RDW‑CV as a categorial variable for adjustment, the risk of death in the patients with RDW‑CV equal to or above 15.4% vs below 15.4% was higher by 225% (95% CI, 107%– 411%; P <0.001) (Supplementary material, Figures S4 and S5).
The same kind of analyses repeated for the SHFSM followed a similar pattern, that is, the risk of death per 1 SD increment of RDW‑CV was higher by 35% (95% CI, 5%–72%; P = 0.02), and higher by 155% (95% CI, 56%–318%; P = 0.002) when we expressed RDW‑CV as a continuous or categorial variable, respectively (Table 3) (Supplementary material, Figures S6 and S7).
Mortality risk at 3 years | ||
Parameter | OR (95% CI) | P value |
Abbreviations: RDW‑CV, red cell distribution width‑coefficient of variation; others, see Table 2 | ||
MAGGIC‑HF 3‑year risk of death raw analysis, per 1 SD increase | 2.39 (1.88–3.04) | <0.001 |
MAGGIC‑HF 3‑year risk of death, per 1 SD increase adjusted by RDW‑CV taken as a continuous variable | 2.11 (1.65–2.7) | <0.001 |
MAGGIC‑HF 3‑year risk of death, per 1 SD increase adjusted by RDW‑CV taken as a categorial variable <15.4% or ≥15.4% | 2.04 (1.59–2.61) | <0.001 |
Mortality risk at 5 years | ||
SHFSM 5‑year risk of death, per 1 SD increase | 2.49 (1.49–3.19) | <0.001 |
SHFSM 5‑year risk of death, per 1 SD increase
adjusted by RDW‑CV taken as a continuous variable | 2.19 (1.68–2.86) | <0.001 |
SHFSM 5‑year risk of death, per 1 SD increase
adjusted by RDW‑CV taken as a categorial variable <15.4% or ≥15.4% | 2.09 (1.6–2.71) | <0.001 |
Discussion
The main finding of our study is that despite reasonably fair calibration of our cohort, with both MAGGIC‑HF and SHFSM scores, the risk prediction by these estimators in the patients with higher RDW‑CV was clearly far below actual mortality risk. Based on our data, the limited prognostic efficiency of the MAGGIC‑HF and SHFSM scores may appear in as many as 29% of chronic HFrEF patients in whom RDW‑CV exceeded the cutoff of 15.4%. This prognostic failure may clearly lead to inadequate decision‑making in terms of patient care planning, and finally to potentially avoidable worse outcomes. For example, in the patients in whom the risk is underestimated, the referral to a more advanced treatment method, such as heart transplantation or mechanical support, may be postponed. Our observation highlights the increasing role of RDW‑CV as an inexpensive and easy‑to‑measure biomarker that provides prognostic information beyond that captured by the MAGGIC‑HF or SHFSM score.
Numerous previous studies and meta‑analyses showed a strong prognostic potential of RDW in various pathologies. Among such diseases or clinical syndromes, there are noncardiovascular problems, such as sepsis,19 COVID‑19,20 contrast nephropathy,21 chronic kidney disease,22 chronic obstructive pulmonary disease,23 diabetes,24 various cancers25,26 and acute pancreatitis,27 as well as cardiovascular diseases including pulmonary embolism,28 atrial fibrillation,29 stable coronary artery disease,30 acute coronary syndromes,31 peripheral arterial disease,32 stroke,33 and also HF.34-38 The list mentioned above represents some of the clinical situations in which RDW was proved useful as a prognostic marker.
The striking universality of RDW‑CV in capturing mortality risk in different clinical scenarios may suggest that elevated RDW‑CV values reflected the aggregated effects of different pathophysiological pathways. In fact, a large number of factors may contribute to the elevation of RDW, including excessive neuroactivation, inflammation, oxidative stress, malnutrition, and various microelement deficits, as summarized in recent reviews.17,18
This universality may be the most important in the patients with chronic HFrEF, because a large proportion of the risk in these patients comes from multimorbidity, as clearly documented in a large number of previous research.39 A recent epidemiologic study in almost 1 million of people living in Sweden presents chronic HFrEF in the wider context of coexisting chronic diseases. In this perspective, chronic HFrEF should not be regarded as a central pathology with other diseases as unpleasant companions, but rather as a component of high‑risk clinical state,40 in which prognostication should rely on markers capturing the risk from as many recognized sources as possible. Bearing in mind the high universality of RDW, it is tempting to speculate that in the multimorbid state, with chronic HFrEF as one of the components, RDW may have particularly high prognostic strength. Moreover, it is well established that the clinical trajectory of chronic HFrEF is also strongly influenced by multimorbidity.41 All these factors can make RDW an interesting biomarker allowing for prediction of clinical trajectory and prognosis. The prognostic strength of RDW has already been shown in multimorbidities including chronic HFrEF, for example in frail chronic HFrEF patients42 and in chronic HFrEF with coexisting diabetes.43
A large number of prognostic scores in chronic HFrEF have been developed so far. Most of them predict short- or medium‑term mortality in acute, advanced chronic HFrEF and, to a lower extent, in chronic HFrEF. Despite the well‑established power of RDW to predict mortality in chronic HFrEF, only a few scores included RDW as a component.44,45 The efficiency of longer‑term prognostic scores, such as the MAGGIC‑HF or SHFSM, has never been tested across a range of RDW. Our study is the first to show a decrease in the prognostic power of these estimators in the patients with elevated RDW‑CV. The reason for this finding may be at least partially explained by 2 facts. First, the patients with higher RDW‑CV had also lower hemoglobin levels and higher MCV, suggesting a potential iron deficiency. Second, the higher RDW‑CV group also showed greater weight loss during HF. All these factors are known to aggravate the symptoms and worsen the prognosis even in optimally treated chronic HFrEF patients.46,47 However, neither of them has been included in the MAGGIC‑HF or SHFSM algorithm used for the risk calculation. Anemia, iron deficiency, and wasting as potential links between the elevated RDW‑CV and higher than estimated by the MAGGIC‑HF and SHFSM risk of mortality warrant further studies.
The clear overestimation of true long‑term risk by the SHFSM needs a comment. The reason for this disagreement remains unknown. However, we believe that regardless of pathophysiologic background of the overestimation, and the fact that it ignites unnecessary alarm in treating clinicians, it may finally turn out beneficial for the patient by stimulating more patient‑oriented care.
Our study has obvious limitations. The relatively small number of participants in the study group with chronic HFrEF may have impacted the validity of our results. The lack of standardization of RDW‑CV measurements across different diagnostic analyzers requires identification, in each specific cohort, of the RDW‑CV value above which the risk starts to rise. We did not have data on iron metabolism, so we could not directly explore the association of iron deficiency, anemia or both with elevated RDW‑CV and increased death risk.
We concluded that higher values of RDW‑CV may obscure the prognostic performance of long‑term risk estimators in HF, such as the MAGGIC‑HF and SHFSM, and in such patients, clinical reasoning and care planning should be extended to take into account also the value of RDW‑CV. Higher values of RDW‑CV in the patients with chronic HFrEF are strongly associated with poor long‑term clinical outcome independently of the risk disclosed by the MAGGIC‑HF or SHFSM. It seems prudent to take into account RDW‑CV as a valuable risk marker in future work on prognostic scores in chronic HFrEF. In terms of further research on the role of RDW as a prognostic tool used in the patients treated for chronic HFrEF, we hope that the long‑term results of our analyses will be more widely used in everyday clinical practice.
- Lippi G, Sanchis‑Gomar F. Global epidemiology and future trends of heart failure. AME Med J. 2020; 5: 15. | Crossref
- Puch‑Walczak A, Bandosz P, Grodzicki T, et al. Prevalence of self‑reported heart failure in the adult Polish population: results of the NATPOL 2011 study. Pol Arch Intern Med. 2022; 132: 16184. | Crossref
- Rozentryt P. The fog over heart failure epidemiology in Poland has just started to rise. Pol Arch Intern Med. 2022; 132: 16247. | Crossref
- http://analizy.mz.gov.pl:8080/app/niewydolnoscserca/ ‑ own compilation based on NFZ data. Accessed April 10, 2023.
- Bassi NS, Ziaeian B, Yancy CW, et al. Association of optimal implementation of sodium‑glucose cotransporter 2 inhibitor therapy with outcome for patients with heart failure. JAMA Cardiol. 2020; 5: 948‑951. | Crossref
SUPPLEMENTARY MATERIAL
ARTICLE INFORMATION