
Elevated serum copper improves risk stratification for high-risk plaques identified on optical coherence tomography in chronic coronary syndrome
Key words: atherosclerosis, chronic coronary syndrome, copper, high-risk plaque, optical coherence tomography

 CC BY 4.0
Elevated serum copper improves risk stratification for high-risk plaques identified on optical coherence tomography in chronic coronary syndrome
CC BY 4.0
Introduction: Chronic coronary syndrome (CCS) refers to a spectrum of clinical manifestations of coronary artery disease, excluding acute coronary syndrome (ACS), which is characterized by acute thrombosis. Identifying risk factors associated with plaque stability is crucial for preventing progression of CCS to ACS.
Objectives: This study aimed to explore the associations between serum copper levels and high‑risk plaque (HRP) in patients with CCS, and to evaluate the potential of serum copper level as a novel diagnostic biomarker for HRP.
Patients and methods: In this cross‑sectional study, 80 CCS patients undergoing coronary angiography were enrolled. Plaque characteristics were systematically assessed using optical coherence tomography (OCT), and inflammatory parameters and serum copper concentrations were measured. Logistic regression models were employed to examine the association between variables and HRP. Receiver operating characteristic analysis was used to evaluate the discriminatory performance of biomarkers.
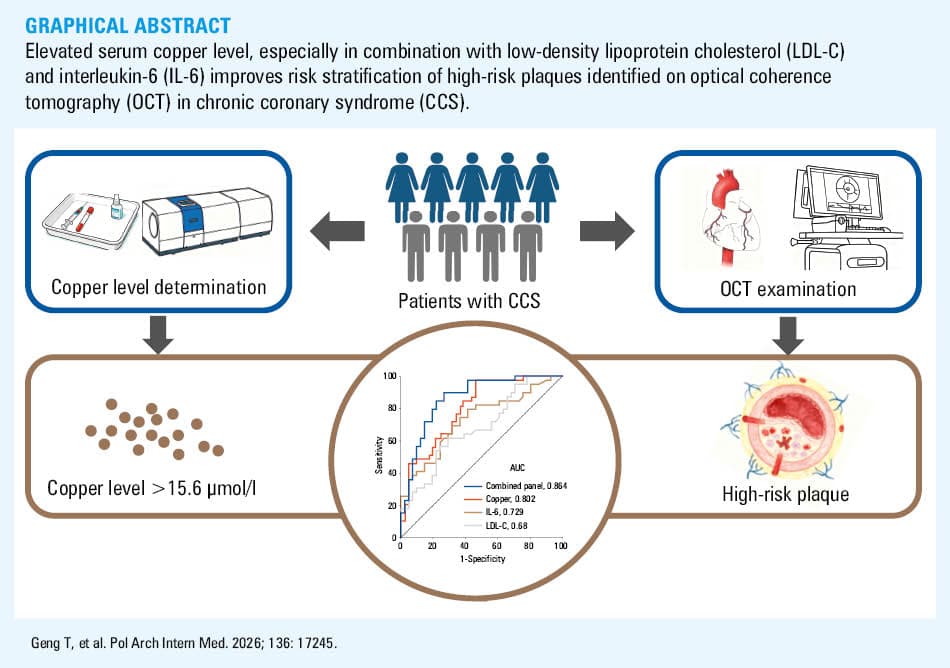
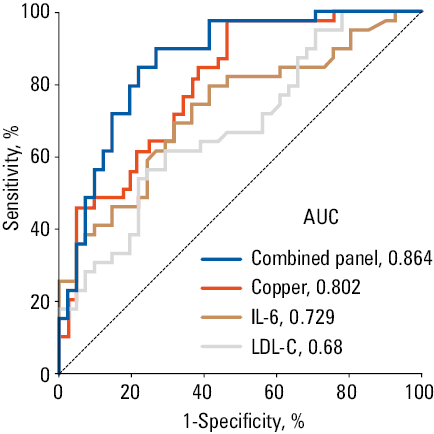
Results: HRP was detected in 39 patients (48.8%). Serum copper levels were significantly higher in the HRP group than in the stable plaque group. Copper levels correlated positively with interleukin 6 (IL‑6) and matrix metalloproteinase‑9, and inversely with IL‑10 levels. Serum copper level was an independent predictor of HRP and showed good discriminatory ability. A biomarker panel combining serum copper, low‑density lipoprotein cholesterol (LDL‑C), and IL‑6 achieved an area under the curve of 0.864, which was significantly superior to any single biomarker alone.
Conclusions: Elevated serum copper level is independently associated with OCT‑defined HRP in CCS patients. A combined model incorporating copper, LDL‑C, and IL‑6 significantly improves the noninvasive identification of HRP, suggesting a potential multimarker strategy for risk stratification in CCS.
What's new?
This study demonstrates a significant and independent association between serum copper levels and optical coherence tomography–defined high‑risk plaque in patients with chronic coronary syndrome. Copper level shows good discriminatory performance for plaque vulnerability, which is further enhanced when combined with low‑density lipoprotein cholesterol and interleukin 6 concentrations. These results support a potential role of copper in plaque destabilization related to inflammatory activity and matrix degradation.
Introduction
The 5‑year incidence of major adverse cardiovascular events, including cardiovascular death and nonfatal myocardial infarction, among patients with chronic coronary syndrome (CCS) is approximately 9.2%.1 High‑risk plaque (HRP), characterized by features such as thin‑cap fibroatheroma, large lipid core, and intraplaque hemorrhage, is a key driver of CCS progression to acute coronary syndrome (ACS),2-4 making the identification of HRP crucial for risk stratification and targeted intervention in CCS patients. Several candidates have been proposed as predictors of HRP. For instance, Henzel et al5 demonstrated that quantification of epicardial adipose tissue volume via noncontrast computed tomography could facilitate the clinical assessment of HRP. The present study adopted another imaging modality to explore HRP predictors. Optical coherence tomography (OCT), a high‑resolution intravascular imaging technique, enables direct visualization of coronary plaque morphology (eg, fibrous cap thickness, lipid core size) and is widely recognized as a reference standard for HRP diagnosis6—a criterion also adopted in this study to define HRP. However, widespread clinical application of OCT is limited due to its invasive nature, associated procedural risks, and high costs. Thus, there is an urgent need for early, noninvasive, and convenient biomarkers to improve HRP detection in CCS patients.
Copper, an essential trace element in human metabolism, has been implicated in the pathogenesis of atherosclerosis due to its involvement in oxidative stress, inflammation, and extracellular matrix remodeling.7-9 Previous studies have demonstrated an association between abnormal serum copper levels and susceptibility to coronary artery disease.10,11 Moreover, elevated copper levels have been identified in atherosclerotic plaques,12,13 underscoring the potential interaction between serum copper, inflammatory mediators, and their active involvement in the progression of atherosclerotic plaque. However, limited research has explored the specific association between serum copper level and HRP in CCS patients.
Clinical risk scores based on traditional coronary artery disease risk factors have limitations.14,15 Therefore, the objective of this cross‑sectional study was to investigate the associations between serum copper levels and HRP in CCS patients to provide a novel approach for cardiovascular risk assessment and therapy monitoring.
Patients and methods
Patients and study design
Inclusion criteria required that participants were aged between 18 and 90 years, capable and willing to provide written informed consent, and hospitalized with a confirmed diagnosis of CCS.
Key exclusion criteria comprised: 1) pre‑existing active inflammatory state (high‑sensitivity C‑reactive protein ≥10 mg/l); 2) uncontrolled infectious diseases; 3) known autoimmune or immune‑related diseases (eg, systemic lupus erythematosus, asthma, inflammatory bowel disease, gout, malignant tumor, etc.); 4) in‑stent restenosis; 5) poor‑quality OCT images; and 6) unsuitability for this trial as deemed by the investigators (eg, severe renal / hepatic dysfunction, hemodynamic instability, inability to provide informed consent).
A total of 102 consecutive patients with CCS who underwent OCT at the Cardiology Department of Shanghai East Hospital between May and October 2025 were included in this cross‑sectional study. A total of 22 patients were excluded for the following reasons: refusal to participate (n = 12), in‑stent restenosis (n = 5), poor‑quality OCT images (n = 4), and suspected systemic inflammatory disease (n = 1). Ultimately, a cohort of 80 patients underwent comprehensive evaluation (Figure 1). Informed consent was acquired from all participants, and the study received approval from the Ethics Committee of Shanghai East Hospital (2025505).
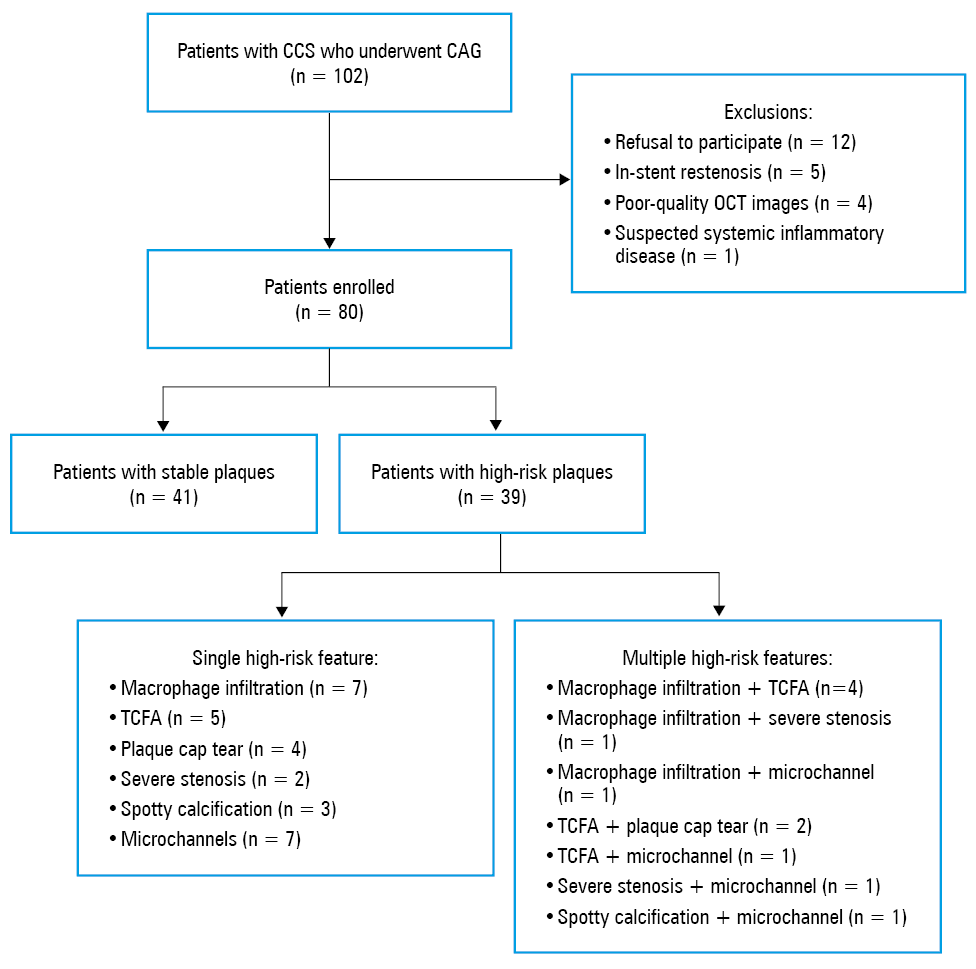
Abbreviations: CCS, chronic coronary syndrome; CAG, coronary angiography; OCT, optical coherence tomography; TCFA, thin‑cap fibroatheroma
Atomic absorption spectroscopy
The patients scheduled for enrollment following coronary angiography (CAG) evaluation had approximately a 5‑ml of coronary artery blood sample drawn from the site of the target plaque with a 5F Tig catheter (Terumo Corporation, Tokyo, Japan). The samples were collected into copper‑free centrifuge tubes, and centrifuged at 3000 rpm for 10 minutes, after which the upper serum was carefully collected and preserved in liquid nitrogen for analysis. Serum copper levels were quantified using a TAS‑990 atomic absorption spectrometer (Beijing General Purpose, Beijing, China).12
Enzyme‑linked immunosorbent assay
Inflammatory markers, including interleukin 6 (IL‑6), IL‑10, and matrix metalloproteinase‑9 (MMP‑9), were evaluated using commercially available biotin / avidin‑based enzyme‑linked immunosorbent assay kits (Jianglaibio, Shanghai, China).
Data collection
Data for this study were systematically collected from the hospital electronic health record system. The extracted variables encompassed baseline demographics, medical history, relevant laboratory parameters, and angiographic findings. Furthermore, the complexity of coronary artery lesions was assessed for every patient using the SYNTAX score I, which was calculated via the official online calculator available at https://syntaxscore.org.
Optical coherence tomography imaging
The OCT imaging was performed by withdrawing the imaging catheter through the target vessel segment. The ILUMIEN OPTIS OCT imaging system (C408661, Abbott Medical, Santa Clara, California, United States) and a Dragonfly OCT catheter (C408645, Abbott Medical) were utilized. Analyses of the OCT images were conducted by 2 experienced OCT technicians blind to the patient clinical status. When there was a significant difference in the findings of the 2 technicians, a senior physician performed a comprehensive evaluation. Based on the OCT image characteristics, the plaque types were divided into 4 categories: 1) fibrous plaques, characterized by intimal thickening with a homogeneous bright signal; 2) calcified plaques, presenting as intimal thickening with low signal intensity and sharply delineated borders; 3) lipid plaques, identified by intimal thickening with hypointensity and poorly defined boundaries; and 4) mixed plaques, defined by the presence of 2 or more of the aforementioned components. In addition to qualitative plaque characterization, the following key quantitative metrics were systematically collected: the minimal lumen area and the plaque burden. The minimal lumen area was measured at the narrowest point of the lumen, while the plaque burden was calculated to quantify the proportion of the vascular cross‑sectional area occupied by the plaque relative to the total area defined by the external elastic membrane. To mitigate the risks associated with prolonged procedure time and minimize the potential for contrast‑induced renal toxicity, it is a conventional clinical practice to perform OCT solely on the vessel with the most severe stenosis for prepercutaneous coronary intervention lesion assessment and procedural guidance. Accordingly, in patients with multivessel disease, the examination was confined to the vessel exhibiting the most severe stenosis.
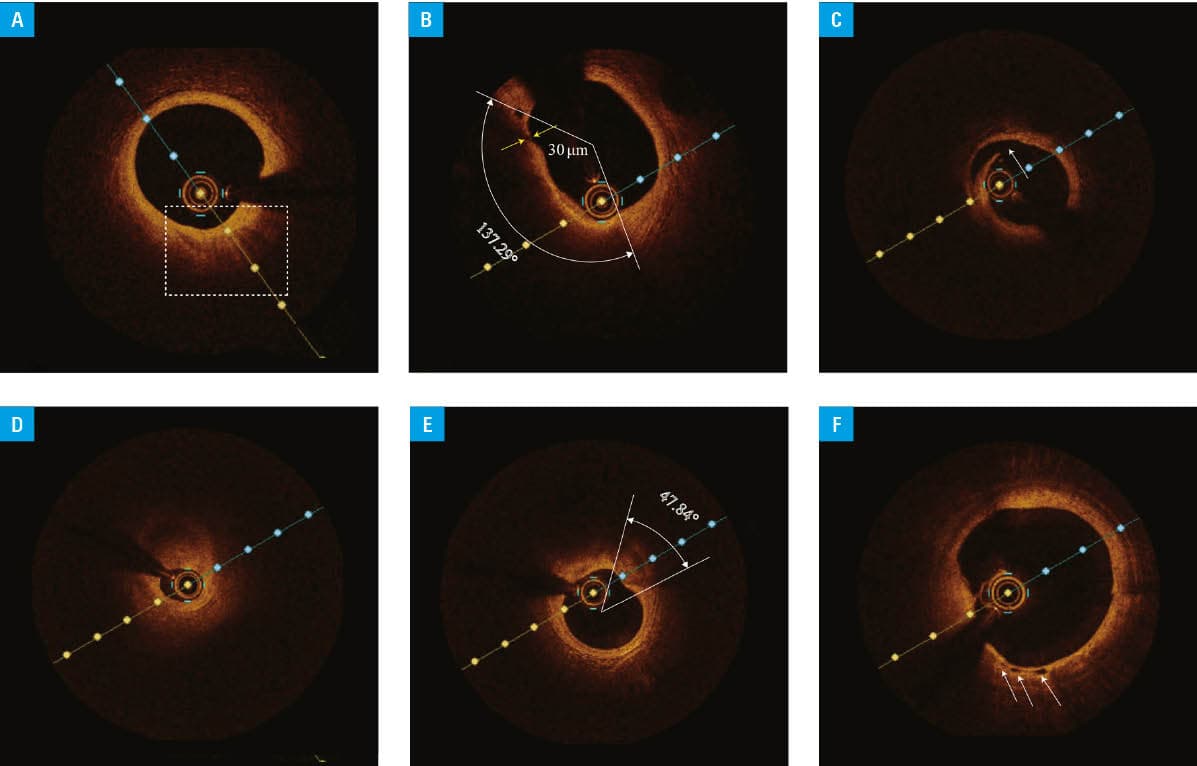
HRPs on OCT were identified by the presence of at least 1 of the following criteria: 1) macrophage infiltration, defined as the presence of signal‑rich superficial clusters or punctate bright spots with dorsal shadowing16,17; 2) thin‑cap fibroatheroma (TCFA), identified as a signal‑poor lipid core encompassing at least 90 ° of the vessel circumference and covered by a fibrous cap with a thickness of up to 65 µm18; 3) fibrous cap rupture, presenting as a clear discontinuity of the fibrous cap that establishes communication between the lumen and the underlying necrotic core; 4) severe stenosis, defined as a reduction in the lumen area of at least 90%3; 5) spotty calcification, appearing as a punctate calcific deposit with a calcification arc below 90 ° and a length below 10 mm; 6) tortuous microchannels (<300 µm in diameter) traversing the plaque19-22 (Figure 2).
Statistical analysis
Continuous variables were reported as mean (SD) or median (interquartile range [IQR]) and compared using the t test or the Mann–Whitney test. Categorical variables were reported as percentage and compared using the χ2 test or the Fisher exact test. Spearman rank correlation coefficient was used to evaluate bivariate correlations between variables. Univariable and multivariable logistic regression analyses were conducted to assess the independent association of clinical characteristics and laboratory parameters (listed in Table 1) with HRP occurrence. Variables with a P value below 0.1 in the univariable analysis were included in the multivariable analysis, and the multivariable regression model was built using stepwise variable selection (entry and removal thresholds, 0.05 and 0.1, respectively). A sensitivity analysis was conducted using an alternative definition of HRP, which required meeting at least 2 of the following 4 criteria: 1) lipid arc of at least 90 °; 2) minimum fibrous cap thickness below 65 µm; 3) presence of plaque rupture or thrombus; and 4) macrophage infiltration. Receiver operating characteristic (ROC) curves were used to assess the prognostic value of biomarkers for HRP progression. Areas under the curve (AUCs) were calculated, optimal cutoff values were determined based on the maximum Youden index, and the DeLong test was used to compare AUCs among the parameters. All analyses were performed using R software (version 4.4.1, R Foundation for Statistical Computing, Vienna, Austria). A 2‑tailed P value below 0.05 was considered significant.
Variable | Total (n = 80) | HRP (n = 39) | SP (n = 41) | P value | |
Data are presented as number (percentage) or median (interquartile range) unless indicated otherwise.
SI conversion factors: to convert ALT and AST to μkat/l, multiply by 0.0167; NT‑proBNP to ng/l, by 1.
Abbreviations: ACEI, angiotensin‑converting enzyme inhibitor; ALT, alanine aminotransferase; AMI, acute myocardial infarction; ARB, angiotensin receptor blocker; AST, aspartate aminotransferase; HDL‑C, high‑density lipoprotein cholesterol; HRP, high‑risk plaque; hs‑CRP, high‑sensitivity C‑reactive protein; IL, interleukin; LDL‑C, low‑density lipoprotein cholesterol; MMP‑9, matrix metalloproteinase‑9; NT‑proBNP, N‑terminal pro–B‑type natriuretic peptide; SGLT2i, sodium‑glucose cotransporter 2 inhibitor; SP, stable plaque | |||||
Demographic characteristics | |||||
Age, y, mean (SD) | 66.7 (9.2) | 67.5 (9.7) | 65.9 (8.7) | 0.44 | |
Men | 58 (72.5) | 27 (69.2) | 31 (75.6) | 0.53 | |
Body mass index, kg/m2, mean (SD) | 24.4 (3.1) | 24.7 (3.1) | 24.2 (3.1) | 0.54 | |
Prior AMI | 6 (7.5) | 3 (7.7) | 3 (7.3) | >0.99 | |
Hypertension | 56 (70) | 27 (69.2) | 29 (70.7) | 0.88 | |
Diabetes mellitus | 29 (36.3) | 15 (38.5) | 14 (34.1) | 0.69 | |
Atrial fibrillation | 5 (6.3) | 2 (5.1) | 3 (7.3) | >0.99 | |
Smoking | 25 (31.3) | 13 (33.3) | 12 (29.3) | 0.7 | |
Alcohol abuse | 12 (15) | 6 (15.4) | 6 (14.6) | 0.93 | |
Medications | |||||
Aspirin | 53 (66.3) | 25 (64.1) | 28 (68.3) | 0.69 | |
Clopidogrel | 19 (23.8) | 11 (28.2) | 8 (19.5) | 0.36 | |
ACEI/ARB | 34 (42.5) | 20 (51.3) | 14 (34.1) | 0.12 | |
β-Blocker | 55 (68.8) | 26 (66.7) | 29 (71.7) | 0.7 | |
Calcium channel blocker | 25 (31.3) | 10 (25.6) | 15 (36.5) | 0.29 | |
Statin | 74 (92.5) | 35 (89.7) | 39 (95.1) | 0.43 | |
Metformin | 26 (32.5) | 15 (38.5) | 11 (26.8) | 0.27 | |
SGLT2i | 21 (23.8) | 11 (28.2) | 10 (24.4) | 0.7 | |
Insulin | 7 (8.8) | 2 (5.1) | 5 (12.2) | 0.43 | |
Laboratory parameters (reference range) | |||||
Neutrophils (2–7 × 10³/μl) | 4 (3.2–5) | 4.3 (3.1–5.3) | 4 (3.2–4.9) | 0.8 | |
Lymphocytes (1–3 × 10³/μl) | 1.6 (1.2–2) | 1.5 (1.1–2) | 1.7 (1.2–2.1) | 0.48 | |
Monocytes (0.12–0.8 × 10⁹/l) | 0.5 (0.4–0.6) | 0.5 (0.4–0.6) | 0.5 (0.4–0.6) | 0.72 | |
Platelets (100–300 × 109/l) | 196.5 (161.3–228.8) | 196 (161–229) | 197 (161.5–224.5) | 0.83 | |
Hemoglobin (men, 120–160 g/l; women, 110–150 g/l) | 138.5 (126–149) | 137 (128–149) | 140 (123.5–149) | 0.75 | |
NT‑proBNP (<125 pg/ml) | 77.2 (30.8–235.5) | 78 (35.3–350.7) | 76.3 (27.9–175.9) | 0.5 | |
Triglyceride (<1.7 mmol/l) | 1.4 (1–2.3) | 1.3 (1.1–2.2) | 1.6 (1–2.3) | 0.76 | |
Total cholesterol (<5.2 mmol/l) | 3.8 (2.8–4.5) | 4 (2.9–4.8) | 3.6 (2.7–4.4) | 0.14 | |
LDL‑C (<3.4 mmol/l) | 2.0 (1.4–2.6) | 2.3 (1.6–3.1) | 1.8 (1.2–2.3) | 0.005 | |
HDL‑C (>1 mmol/l) | 1.1 (0.8–1.2) | 1 (0.8–1.2) | 1.1 (0.9–1.2) | 0.35 | |
hs‑CRP (0–3 mg/l) | 1.4 (0.7–2.1) | 1.5 (0.7–2.8) | 1.4 (0.8–1.9) | 0.59 | |
ALT (0–40 U/l) | 22.6 (18.3–29.2) | 22 (18–30) | 23 (19–29) | 0.88 | |
AST (0–40 U/l) | 23.6 (20.7–28.3) | 25 (20.4–29.3) | 23.4 (21–26.2) | 0.5 | |
Creatinine (men, 53–106 μmol/l; women, 44–97 μmol/l) | 77.4 (65–91.1) | 78.5 (63.1–97.6) | 76.3 (66–85.7) | 0.57 | |
Uric acid (men, 208–428 μmol/l; women,155–357 μmol/l) | 320.6 (261.6–384) | 331.4 (272.1–387.3) | 304.8 (258.3–381.6) | 0.61 | |
Copper (11–22 μmol/l) | 18.5 (13.3–28.3) | 23 (17.3–34) | 13.9 (9–19.7) | <0.001 | |
IL‑6 (0–7 pg/ml) | 10.5 (2.4–16.4) | 14.2 (8.9–20.1) | 5.6 (1.9–13.5) | <0.001 | |
IL‑10 (0–18 pg/ml) | 3.7 (2.7–5) | 3.7 (2.6–4.7) | 4 (2.8–5.1) | 0.76 | |
MMP‑9 (0.16–10 ng/ml) | 6 (3.8–9.9) | 7 (4.5–13.7) | 5.5 (3.1–8) | 0.09 | |
Angiographic findings | |||||
Multivessel disease | 1 vessel | 33 (41.3) | 18 (46.2) | 15 (36.6) | 0.68 |
2 vessels | 22 (27.5) | 10 (25.6) | 12 (29.3) | ||
3 vessels | 25 (31.3) | 11 (28.2) | 14 (34.1) | ||
SYNTAX score I, points | 7.6 (3.7) | 7.8 (3.9) | 7.4 (3.5) | 0.61 | |
Results
Study cohort
The study cohort comprised 80 patients, at a mean (SD) age of 66.7 (9.2) years, of whom 72.5% were men. HRP was detected in 39 patients (48.8%; Figure 1). Among these, 28 patients presented with a single high‑risk feature, specifically: macrophage infiltration (n = 7), TCFA (n = 5), plaque cap tear (n = 4), severe stenosis (n = 2), spotty calcification (n = 3), and microchannels (n = 7). The remaining 11 patients exhibited multiple concurrent high‑risk features, including combinations, such as macrophage infiltration with TCFA (n = 4), macrophage infiltration with severe stenosis (n = 1), macrophage infiltration combined with microchannels (n = 1), TCFA with plaque cap tear (n = 2), TCFA with microchannel (n = 1), severe stenosis with microchannel (n = 1), and spotty calcification with microchannel (n = 1).
As detailed in Table 1, significant elevations in median (IQR) levels of low‑density lipoprotein cholesterol (LDL‑C; 2.3 [1.6–3.1] vs 1.8 [1.2–2.3] mmol/l; P = 0.005), copper (23 [17.3–34] vs 13.9 [9–19.7] µmol/l; P <0.001), and IL‑6 (14.2 [8.9–20.1] vs 5.6 [1.9–13.5] pg/ml; P <0.001) were observed in the HRP vs non‑HRP group. However, no significant intergroup differences were found in demographic characteristics, CAG results, or other laboratory parameters. OCT parameters are summarized in Table 2, indicating lower rates of fibrous plaque (25.6% vs 39%) and calcified plaque (10.3% vs 26.8%) but a higher rate of lipid plaque (38.5% vs 7.3%; P = 0.005 for plaque type distribution) in the HRP group. There were no significant differences in the distribution of the imaged coronary artery, plaque burden, or minimal lumen area between the HRP and stable plaque groups.
Variable | Overall (n = 80) | HRP (n = 39) | SP (n = 41) | P value | |
Data are presented as a number (percentage) unless indicated otherwise.
| |||||
Vessel for OCT imaging | LAD | 55 (68.8) | 29 (74.4) | 26 (63.4) | 0.54 |
LCx | 9 (11.3) | 4 (10.3) | 5 (12.2) | ||
RCA | 16 (20) | 6 (15.4) | 10 (24.4) | ||
Plaque type | Fibrous plaque | 26 (32.5) | 10 (25.6) | 16 (39) | 0.005 |
Calcified plaque | 15 (18.8) | 4 (10.3) | 11 (26.8) | ||
Lipid plaque | 18 (22.5) | 15 (38.5) | 3 (7.3) | ||
Mixed plaque | 21 (26.3) | 10 (25.6) | 11 (26.8) | ||
Plaque burden | 72.7 (10.3) | 71.6 (11.9) | 73.7 (8.5) | 0.36 | |
Minimal lumen area, mm2, mean (SD) | 3 (1.3) | 3.2 (1.5) | 2.9 (1.1) | 0.3 | |
Associations of copper levels with demographic characteristics and inflammatory markers
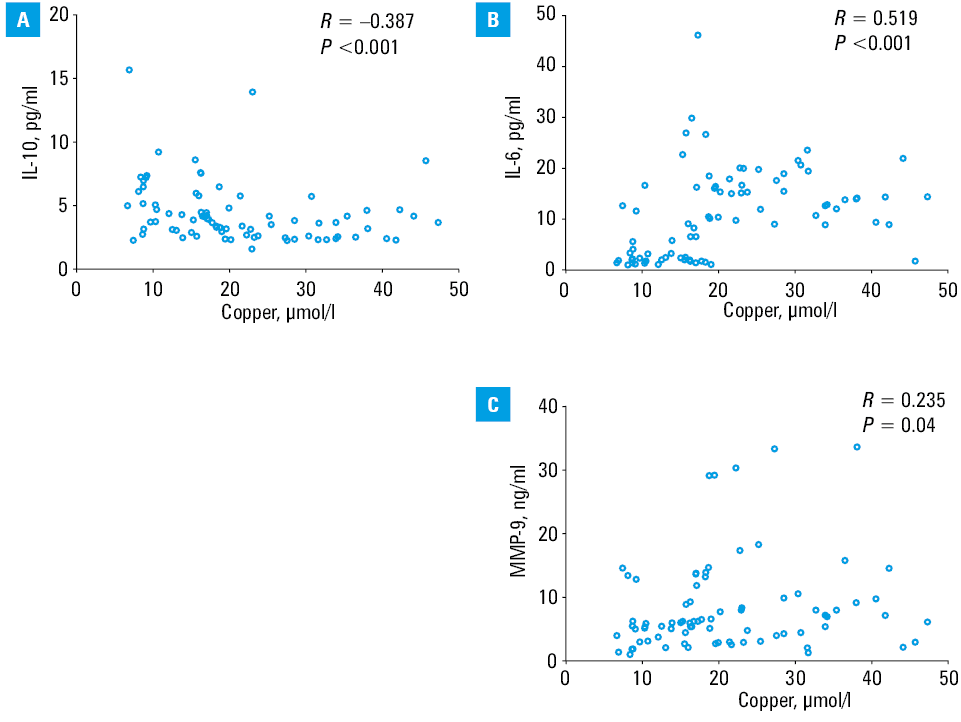
Serum copper levels showed no significant differences across subgroups stratified by sex, age (<65 vs ≥65 y), as well as hypertension, or diabetes status (Supplementary material, Figure S1). In contrast, serum copper levels demonstrated significant correlations with inflammatory markers: a positive correlation with IL‑6 (R = 0.519; P <0.001) and MMP‑9 (R = 0.235; P = 0.04), and a negative correlation with IL‑10 (R = –0.387; P <0.001; Figure 3).
Factors associated with high‑risk plaque occurrence
In Table 3 we show the results of the univariable and multivariable logistic analyses of predictors for factors associated with HRP occurrence. In the univariable analysis, the variables strongly associated with HRP occurrence were: copper levels (odds ratio [OR], 1.14; 95% CI, 1.07–1.22; P <0.001), LDL‑C (OR, 2.21; 95% CI, 1.27–3.84; P = 0.005), and IL‑6 (OR, 1.13; 95% CI, 1.06–1.21; P <0.001). In the multivariable logistic regression model, copper (OR, 1.1; 95% CI;, 1.03–1.17; P = 0.005), LDL‑C (OR, 2.54; 95% CI, 1.25–5.16; P = 0.01), and IL‑6 (OR, 1.1; 95% CI, 1.02–1.18; P = 0.01) yielded similar results. The Hosmer–Lemeshow goodness‑of‑fit test indicated adequate model calibration (P = 0.8). Moreover, in the sensitivity analysis, where 25 participants met the alternative HRP definition, the association between HRP occurrence and these variables remained essentially unchanged.
Variable | Univariable analysis | Multivariable analysis | Sensitivity analysis | |||
OR (95% CI) | P value | OR (95% CI) | P value | OR (95% CI) | P value | |
The sensitivity analysis was conducted using an alternative definition of HRP, which required meeting at least 2 of the following 4 criteria: 1) lipid arc ≥90 °, 2) minimum fibrous cap thickness <65 µm, 3) presence of plaque rupture or thrombus, and 4) macrophage infiltration.
Abbreviations: OR, odds ratio; others, see Table 1 | ||||||
Copper, μmol/l | 1.14 (1.07–1.22) | <0.001 | 1.1 (1.03–1.17) | 0.005 | 1.09 (1.02–1.16) | 0.009 |
LDL‑C, mmol/l | 2.21 (1.27–3.84) | 0.005 | 2.54 (1.25–5.16) | 0.01 | 2.7 (1.3–5.62) | 0.008 |
IL‑6, pg/ml | 1.13 (1.06–1.21) | <0.001 | 1.1 (1.02–1.18) | 0.01 | 1.11 (1.03–1.19) | 0.007 |
Diagnostic performance of individual and combined biomarkers
A combined biomarker panel incorporating serum copper, LDL‑C, and IL‑6 was developed using multivariable logistic regression to enhance the diagnostic accuracy of HRP. The predicted probability of HRP (P) was calculated as: logit(P) = 0.094 × Copper + 0.93 × LDL‑C + 0.093 × IL‑6 − 4.999, where logit(P) is the log‑odds of HRP presence derived from the biomarker levels. The corresponding probability is derived as P = 1 / (1 + e^−logit(P)).
ROC curve analysis revealed superior diagnostic performance of the combined panel’s predictive probability, as compared with individual biomarkers (Figure 4, Table 4). The combined panel achieved an AUC of 0.864 (95% CI, 0.783–0.945), markedly outperforming single biomarkers, that is, copper (AUC, 0.802; 95% CI, 0.706–0.897; P = 0.04), LDL‑C (AUC, 0.68; 95% CI, 0.563–0.797; P = 0.002), and IL‑6 (AUC, 0.729; 95% CI, 0.617–0.84; P = 0.004) as determined by the DeLong test. Based on the maximum Youden index (J = Sensitivity + Specificity − 1), the optimal probability cutoff value of 0.4 for the combined panel was determined. Using this cutoff value, the panel achieved sensitivity of 84.6%, specificity of 73.2%, positive predictive value of 75%, and negative predictive value of 83.3%.
Abbreviations: AUC, area under the curve; others, see Table 1
Variable | Cutoff value | Sensitivity, % | Specificity, % | Positive predictive value, % | Negative predictive value, % | AUC (95% CI) | P value for the DeLong test |
The combined panel is a logistic regression model using serum copper, LDL‑C, and IL‑6 as independent variables. The logit of the predicted probability (P) for HRP is calculated as: logit(P) = 0.094 × Copper + 0.93 × LDL‑C + 0.093 × IL‑6 − 4.999. The corresponding probability is derived as P = 1 / (1 + e^−logit(P)).
| |||||||
Predicted probability (P) of the combined panel | 0.4 | 84.6 | 73.2 | 75 | 83.3 | 0.864 (0.783–0.945) | Reference |
Copper | 15.6 | 92.3 | 53.7 | 65.5 | 88 | 0.802 (0.706–0.897) | 0.04 |
IL‑6 | 10.4 | 69.2 | 65.9 | 65.9 | 69.2 | 0.729 (0.617–0.84) | 0.004 |
LDL‑C | 2.3 | 61.5 | 68.3 | 64.9 | 65.1 | 0.68 (0.563–0.797) | 0.002 |
Prevalence of high‑risk plaque in patients with different elevated biomarkers
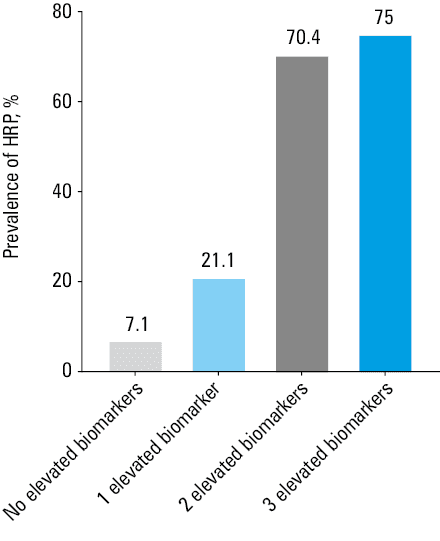
Optimal cutoff values for serum copper, LDL‑C, and IL‑6 were established as 15.6 μmol/l, 2.3 mmol/l, and 10.4 pg/ml, respectively (Table 4). Biomarker levels exceeding these thresholds were classified as elevated. The patients were stratified into 4 groups based on the number of elevated biomarkers (0, 1, 2, or 3). The prevalence of HRP increased markedly with the number of elevated biomarkers, occurring in 7.1% of the patients with no elevated markers, 21.1% of those with 1 elevated marker, 70.4% of individuals with 2 elevated markers, and 75% of those with 3 elevated markers (Figure 5).
Discussion
This study investigated the relationship between serum copper and HRP detected on OCT in patients with CCS, and assessed the added value of combining copper with LDL‑C and IL‑6 levels for risk prediction. Our key findings are as follows. First, serum copper level was significantly elevated in patients with HRP, and independently predicted HRP occurrence. Second, copper levels correlated with inflammatory markers, suggesting a link to plaque inflammation and instability. Third, a combined biomarker panel incorporating copper, LDL‑C, and IL‑6 markedly improved the diagnostic accuracy of HRP over individual markers alone. These results support the potential utility of determining serum copper level, especially in combination with established biomarkers, for enhanced stratification of coronary plaque risk.
Copper is an essential trace element existing primarily as Cu+ (intracellular, 95%) and Cu2+ (extracellular, 5%), with its homeostasis tightly regulated by a network of transporters and chaperones. Dietary intake (eg, copper‑rich foods) and environmental exposure are major sources, and intestinal absorption of Cu2+ is mediated by copper transporter 1, followed by systemic transport via ceruloplasmin and albumin. The liver serves as the core organ for copper storage and excretion, with excess copper secreted into bile via adenosine triphosphatase (ATPase) copper transporting β, while ATPase copper transporting α mediates copper efflux in most other tissues. Copper disequilibrium (overload or deficiency) disrupts redox balance, induces oxidative stress via Fenton reaction, impairs mitochondrial function, and triggers cuproptosis, thereby contributing to atherosclerotic plaque vulnerability, myocardial injury, and heart failure.23,24 Copper homeostasis depends on subtle interactions among the uptake, transport, and clearance of micronutrients during physiological processes, which may have therapeutic potential for cardiovascular and metabolic conditions.24
A previous study reported higher copper concentrations in the intima of atherosclerotic vessels, as compared with healthy ones, suggesting its potential role in plaque development.25 Intriguingly, another study, involving 1814 residents of Shanghai, reported a median (IQR) serum copper level of 14.1 (12.3–16) μmol/l,26 which was comparable to that observed in the stable plaque group in our study but significantly lower than that in the HRP group. Building upon this groundwork, our study provides initial, exploratory evidence suggesting an association between serum copper levels and certain OCT‑defined HRP features in patients with CCS rather than merely disease presence.
The mechanistic underpinnings of the copper‑HRP association are likely multifaceted, with inflammation and extracellular matrix degradation appearing central. Our correlation analyses provided compelling clinical support for this notion. The positive correlation between serum copper and the proinflammatory cytokine IL‑6, coupled with the negative correlation with the anti‑inflammatory cytokine IL‑10, suggested that copper may be intricately involved in fostering a proinflammatory milieu conducive to plaque destabilization. This was consistent with experimental data showing that copper can induce reactive oxygen species and activate proinflammatory signaling pathways, such as NF-κB transcription factor, leading to upregulation of inflammatory mediators.27 Additionally, a positive correlation between copper and MMP‑9 level was observed. MMP‑9, predominantly secreted by macrophages within the fibrous cap, plays a critical role in degrading the extracellular matrix, thereby weakening the plaque’s structural integrity and enhancing its vulnerability to rupture.4,28 This correlation suggested a potential pathway whereby copper may contribute to plaque instability by promoting MMP‑9–mediated degradation of the fibrous cap. Our results indicate that, among the 39 HRPs, 12 exhibited the characteristic of a thin fibrous cap. While it is uncertain whether this proportion will remain consistent with a larger sample size, it is clear that the presence of a thin fibrous cap is an important feature of vulnerable plaques.
Elevated copper levels may promote occurrence of key risk factors for atherosclerosis, particularly type 2 diabetes.29,30 Epidemiologic investigations have demonstrated a robust association between copper intake and the risk of diabetes mellitus, with the correlation being particularly pronounced among the elderly, overweight individuals, smokers, and those with a family history of diabetes, suggesting that copper may serve as a potential biomarker for diabetes susceptibility.31-34 However, our results showed no significant differences in serum copper concentrations between diabetic and nondiabetic participants. Similarly, a recent prospective cohort study conducted in China reported a relatively weak association between dietary copper intake and type 2 diabetes mellitus.35 This discrepancy can be attributed to differences in the study populations.
The deposition of LDL‑C in the arterial wall triggers the formation of foam cells and initiates an inflammatory cascade that plays a pivotal role in plaque progression and instability. Elevated levels of LDL‑C have long been associated with an increased risk of plaque rupture, concurrently, inflammatory responses, particularly involving cytokines, such as IL‑6, have been shown to exacerbate plaque vulnerability.36 This is consistent with our observations, where, after adjusting for confounding factors in the multivariable logistic regression model, copper, IL‑6, and LDL‑C levels remained significantly associated with the occurrence of HRP. In light of these findings, we developed a logistic regression model, which combines serum copper level with traditional risk markers to improve the prediction of HRP progression. This combined model exhibited robust diagnostic performance, with an AUC of 0.864, surpassing the predictive power of copper alone (AUC = 0.802). The integration of copper, a key modulator of oxidative stress and inflammation, alongside well‑established lipid and inflammatory markers, provides a comprehensive approach to identifying HRP. Notably, isolated LDL‑C levels showed inferior predictive performance, as compared with serum copper (AUC, 0.68 vs 0.802). This may reflect the fact that 92.5% of the patients received statin therapy, which reduces and homogenizes LDL‑C levels, attenuating its discriminatory ability. Conversely, inflammatory biomarkers, such as IL‑6 and copper, maintain significant variance and predictive utility in statin‑treated patients.
Patients with CCS often experience periods of stability, but the disease typically progresses over time, with an increasing risk of adverse cardiovascular events. This progression can be insidious, as CCS patients may not present with persistent chest pain, elevated biomarkers of acute myocardial injury, or dynamic electrocardiogram changes. Consequently, CCS patients may not receive adequate clinical attention, leading to missed opportunities for early intervention. Given that most plaque stability assessments are invasive or contrast‑derived, there is a pressing need for reliable, noninvasive biomarkers that can facilitate the early detection of vulnerable plaques to prevent progression to ACS. Validated strategies to lower circulating copper concentrations encompass copper chelators, including trientine, triethylenetetramine, and tetrathiomolybdate, which sequester surplus copper to promote its excretion. Additionally, natural antidotes with low toxicity, such as turmeric and curcumin, as well as targeted ion carriers (eg, Gal‑Cu) that mitigate offtarget accumulation, represent alternative approaches.37,38 Nevertheless, the beneficial effects of copper chelators remain to be evaluated in long‑term clinical studies. Furthermore, combined strategies aimed at mitigating the adverse impacts of copper dysregulation on other modes of cell death and mitochondrial integrity, guided by the expanding insights into cuproptosis, hold considerable promise for the development of novel therapeutic interventions for complex, multifactorial cardiovascular diseases. Other toxic trace elements may also participate in plaque vulnerability through similar pathological pathways. A systematic review by Yu et al39 comprehensively summarized the cardiovascular hazards of lead exposure, demonstrating that long‑term lead exposure, even at low levels, is associated with left ventricular dysfunction and an elevated risk of cardiovascular mortality. Future studies should incorporate multielement profiling, combined with environmental exposure history, to further elucidate the roles of various trace elements in the pathophysiology of atherosclerotic plaques.
Limitations
Several limitations of our study must be acknowledged. First, the relatively small sample size restricts the generalizability of our findings. Larger and more diverse cohorts will be needed to validate these results and establish their broader applicability. Second, the cross‑sectional nature of the study limits our ability to draw conclusions about causal relationships. For instance, atherosclerosis is a chronic inflammatory disorder, and definitive evidence clarifying the causal relationship between the levels of serum copper and inflammatory cytokines, particularly IL‑6, would substantially strengthen the pathophysiological and clinical relevance of serum copper level in the context of atherosclerosis. Third, our study focused solely on CCS patients who underwent CAG, and we did not include patients with unstable angina, a subtype of ACS, which may have been underrepresented due to the absence of ST‑segment elevation on electrocardiography. This could have led to potential misclassification or omission of patients who might exhibit similar plaque vulnerability features. Lastly, the study cohort was predominantly male (72.5%), which limits generalizability to female populations. Women often exhibit different coronary plaque phenotypes, such as plaque erosion rather than rupture, potentially affecting the applicability of our findings.
Despite these limitations, our analysis provides novel insights into noninvasive biomarkers for assessing vulnerable plaque burden and may help refine cardiovascular risk stratification without contrast administration.
Conclusions
In conclusion, elevated serum copper is independently associated with OCT‑defined HRP in CCS patients. A combined model incorporating copper, LDL‑C, and IL‑6 significantly improves noninvasive HRP identification, suggesting a potential multimarker strategy for CCS risk stratification.
- Roger G, Ducrocq G, Mesnier J, et al. Chronic coronary syndromes without standard modifiable cardiovascular risk factors and outcomes: the CLARIFY registry. Eur Heart J. 2024; 45: 2396‑2406. | Crossref
- Ridker PM, Bhatt DL, Pradhan AD, et al. Inflammation and cholesterol as predictors of cardiovascular events among patients receiving statin therapy: a collaborative analysis of three randomised trials. Lancet. 2023; 401: 1293‑1301. | Crossref
- Naghavi M, Libby P, Falk E, et al. From vulnerable plaque to vulnerable patient: a call for new definitions and risk assessment strategies: Part I. Circulation. 2003; 108: 1664‑1672. | Crossref
- Bräuninger H, Krüger S, Bacmeister L, et al. Matrix metalloproteinases in coronary artery disease and myocardial infarction. Basic Res Cardiol. 2023; 118: 18. | Crossref
- Henzel J, Kruk M, Kępka C, et al. Epicardial fat: a noninvasive, noncontrast imaging biomarker for high‑risk plaque monitoring on computed tomography. Pol Arch Intern Med. 2025; 135: 17129. | Crossref
SUPPLEMENTARY MATERIAL
ARTICLE INFORMATION