TERT promoter variants in risk stratification of Polish patients with papillary thyroid carcinoma
Key words: papillary thyroid carcinoma, risk stratification, recurrence, TERT

 CC BY 4.0
TERT promoter variants in risk stratification of Polish patients with papillary thyroid carcinoma
Introduction: Despite extensive research, no independent molecular markers have been identified that could optimize the treatment of patients with papillary thyroid carcinoma (PTC). Proper recurrence risk stratification is crucial for further clinical management and determining the extent of treatment aggressiveness.
Objectives: We focused on the TERT promoter (TERTp) variants, identified in previous research as a poor prognostic factor in patients with PTC, with the aim to analyze the clinical utility of TERTp variants in risk‑stratification of PTC patients.
Patients and methods: We analyzed a set of 188 PTCs for BRAF V600E and TERTp variants to investigate the associations of TERTp variants with clinical factors and their impact on time‑to‑progression.
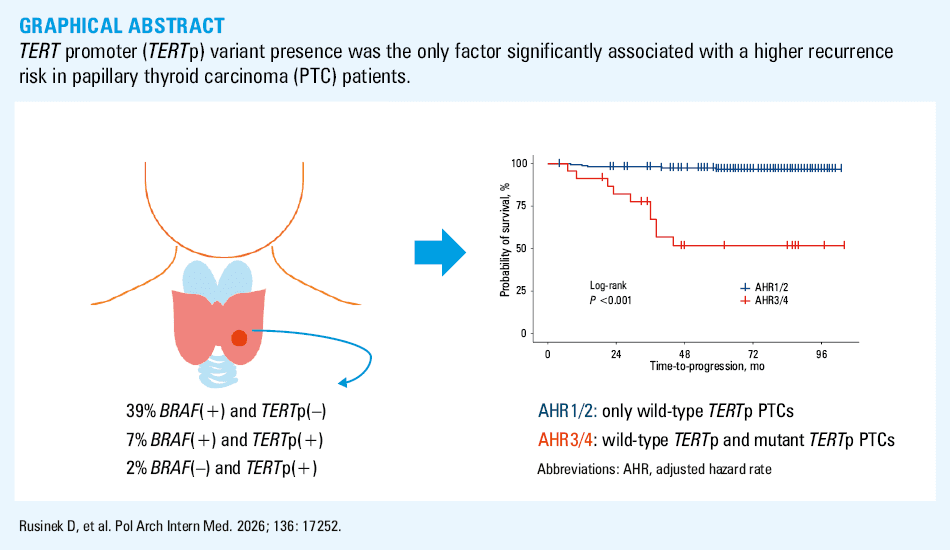
Results: Key observations included an association between the co‑occurrence of BRAF V600E and TERTp variants and persistent disease, poorer response to treatment, and recurrences, as compared with PTCs without these alterations. The results also suggest that the presence of TERTp variants is associated with a shorter time‑to‑relapse.
Conclusions: Detection of TERTp variants should be considered in routine diagnostic procedures, as this would significantly improve patient classification into risk groups.
What's new?
The more we learn about the molecular basis of papillary thyroid carcinoma (PTC), the clearer it becomes that a personalized therapeutic approach is necessary. For patients with PTC, a “one‑size‑fits‑all” treatment approach does not seem practical due to over- or underestimation of the risk of recurrence or metastasis. Our analysis shows an indisputable relationship between the hot spot TERT promoter (TERTp) variants and poorer clinical outcomes. We demonstrated that the presence of TERTp variants was the only factor significantly associated with a higher recurrence risk. Incorporating mutational status analysis of TERTp into routine genetic diagnostics for PTC could significantly improve risk estimation and prediction of treatment response in PTC patients. Therefore, it could help monitor patients with this molecular event in tumor cells more effectively, enabling early detection of disease relapse and selection of a therapeutic approach.
Introduction
Papillary thyroid carcinoma (PTC) accounts for the vast majority of thyroid carcinomas. In most cases, it has an excellent prognosis. It usually grows slowly and is well differentiated, with an indolent clinical course. PTC is associated with long‑term survival rates of 96% after 5 years, 93% after 10 years, and over 90% after 20 years. Mortality rates in PTC patients are relatively low (1%–6.5%),1-3 and they are most often closer to the lower limit of this range.
Nevertheless, the recurrence rate is high, up to 30% of cases.4,5 Risk stratification of PTC is complex. Only a quarter of patients experience PTC relapse, a small percentage develop distant metastases, and a very small percentage die from the disease. Still, it is crucial to stratify patients with PTC according to their risk of recurrence, in order to avoid overtreatment of low‑risk patients and undertreatment of high‑risk ones. For a long time, the so‑called “static,” single‑risk evaluation model was used.6 However, in 2015, an additional “dynamic” risk stratification (DRS) model was recommended by the American Thyroid Association (ATA) guidelines.7 This new approach was first proposed by Tuttle et al,8 and confirmed by several retrospective studies.9 It enables PTC patients to be restratified during follow‑up according to their response to treatment and categorized as having an excellent, incomplete biochemical, incomplete structural, or indeterminate response.7 However, these risk stratification models have limitations, and in some PTC cases they prove to be unreliable. The DRS model is only applicable to patients who have undergone total thyroidectomy and radioiodine ablation.7
The ATA guidelines suggest using molecular markers, such as BRAF and / or TERT promoter (TERTp) variants, as a support in risk evaluation.7 The presence of these markers has been shown to improve risk stratification, but only in conjunction with clinical and pathological factors. For example, the frequency of BRAF V600E (NM_004333.6:c.1799T>A) has been demonstrated to be higher in recurrent PTCs (78%–95% of the recurrent cases).10-13 Nevertheless, it is generally prevalent in PTC, and its correlation with poor prognosis and / or mortality factors has been confirmed in some studies.14 In contrast, others have reported no significant associations.15 Penna et al16 suggest that BRAF mutations play a role in tumor initiation, and should not be considered in isolation as a prognostic marker. The situation is slightly different with TERTp variants, the presence of which has been associated with an aggressive behavior of thyroid tumors, including an increased risk of cancer‑related death. The 2 most frequent TERTp variants (NM_198253.3:c.-124C>T [C228T] and NM_198253.3:c.-146C>T [C250T]) are located at hot spots upstream of the ATG starting site. These alterations increase TERTp activity by creating a new binding site for the E‑Twenty‑Six transcription factor family. The TERT gene is involved in telomere maintenance as well as telomere‑independent processes related to tumorigenesis in cancer cells.17 Evidence suggests that the coexistence of BRAF and TERTp variants is associated with high clinical‑pathological aggressiveness of PTCs.18 However, there is still no consensus on how molecular markers could be incorporated into PTC risk stratification.
In this study, we focused on the clinical implications of the presence of TERTp variants and their potential use in risk stratification in patients with PTC. The analysis was carried out on a set of PTC patients (Polish population). We investigated the usefulness of TERTp mutational status as a prognostic marker for assessing time‑to‑progression in patients diagnosed with PTC.
Patients and methods
The tumor specimens used in this analysis were collected from 188 consecutive Polish patients with PTC who were treated at the Maria Sklodowska‑Curie National Research Institute of Oncology, Gliwice, Poland. This PTC cohort was described in detail in our previous study.19 For the reader’s convenience, the clinical data are summarized in Supplementary material, Table S1 according to the 8th American Joint Committee on Cancer (AJCC)/TNM staging system from 2017,20 with prolonged follow‑up in comparison with data from our previous study. In brief, the analyzed set consisted of 188 PTCs from 166 women and 22 men, at a median age at PTC diagnosis of 53.5 years (range, 12–83 y), and follow‑up ranging from 26 to 98 months. Of those 188 PTCs, 16 (8.5%) were positive for TERTp hot spot variants (C228T or C250T), and 13 out of the 16 TERTp‑positive cases harbored the BRAF V600E variant. Overall, 47% PTCs (89/188) were BRAF-positive, and 6 cases harbored TERTp alterations other than hot spot. TERTp non–hot spot variants included the following: NM_198253.3:c.-100C>T (rs2735943; detected in 1 PTC case together with BRAF V600E variant); NM_198253.3:c.-77C>T, (rs1195843544; detected in 2 cases); NM_198253.3:c.-162C>T (rs2126694591; detected in 1 PTC case together with BRAF V600E variant), and NM_198253.3:c.-80C>T (rs1751312145; detected in 2 cases), all localized upstream of the ATG start codon of TERT. Due to unknown clinical significance of these TERTp variants, they were treated as a separate PTC subgroup (termed TERTp non–hot spot for this publication). All variants are described in Supplementary material, Table S2.
The study was approved by the Bioethics Committee at the Maria Sklodowska‑Curie Memorial Cancer Center and Institute of Oncology, Gliwice Branch and the Bioethics Committee at the Maria Sklodowska‑Curie Memorial Cancer Center and Institute of Oncology, Warszawa ( 13/2015/2016). Informed written consent was obtained from all patients or their caregivers for the use of their tissue in the analysis. All clinical data were anonymized and deidentified prior to analysis.
Statistical analysis
Categorical data were summarized as numbers and percentages. Continuous data were presented as medians and interquartile ranges. To test for significant differences between the analyzed tumor groups, the Fisher exact test (categorical variables) or the Mann–Whitney (continuous variables) test was applied.
Time‑to‑progression curves were estimated using the Kaplan–Meier method, and compared using the log‑rank test. Time‑to‑progression was defined as the time from the diagnosis of PTC to the date on which disease progression was observed or the last known date on which the patient was alive without progression. Univariable and multivariable Cox proportional hazards regression analyses were performed for the following variables: TERTp hot spot variants, BRAF V600E mutation, age at diagnosis (as a continuous variable), and sex. In the case of missing data, the complete case analysis approach was used.
To assess the robustness of the survival analysis results, a bootstrapping analysis was conducted using the censboot function (from the bootstrap R package) to bootstrap survival models with censored observations. In the bootstrap procedure, 1000 bootstrap samples were constructed, for which the underlying survival models were recalculated.
P values were adjusted using the Benjamini–Hochberg false discovery rate (FDR) method in analyses involving multiple comparisons.21 No adjustment for multiple testing was applied to the Cox regression analyses, as only a predefined set of 4 features was evaluated.
All P values were 2‑sided, and a P value below 0.05 was considered significant. The analyses were performed using the “survival” (version 2.41–3) and “Gmisc” (version 1.4.1) packages in R‑3.4.1 (R Foundation for Statistical Computing, Vienna, Austria).
Clinical data regarding initial risk stratification and treatment response were assessed according to the 2015 ATA recommendations.7
Results
Association of BRAF V600E and TERT promoter alterations with clinical features of Polish papillary thyroid carcinoma cohort
First, we analyzed the associations between molecular markers and clinical factors. BRAF(+)TERTp(–) samples were found to have a markedly higher risk of persistent disease (unadjusted P = 0.003; FDR‑adjusted P = 0.01) and a higher likelihood for radioactive iodine (RAI) treatment (unadjusted P <0.001; FDR‑adjusted P = 0.001) than PTCs without BRAF and TERTp variants (NM_PTCs; Table 1).
Parameter | NM_PTCs | BRAF(+)TERTp(–) | BRAF(–)TERTp(+) | BRAF(+)TERTp(+) | TERTp non–hot spot | ||||||||
N (%) | N (%) | Unadjusted P value | FDR‑adjusted P value | N (%) | Unadjusted P value | FDR‑adjusted P value | N (%) | Unadjusted P value | FDR‑adjusted P value | N (%) | Unadjusted P value | FDR‑adjusted P value | |
Data are presented as number (percentage) or median (interquartile range).
P values refer to comparisons between one of the PTC groups with a mutation (BRAF(+)TERTp(–), BRAF(–)TERTp(+), BRAF(+)TERTp(+), or TERTp non–hot spot and PTC without BRAF V600E and TERTp variants (NM_PTC). P values were calculated using the Fisher exact test for categorical variables or the Mann–Whitney test for numerical variables. Percentages were calculated in relation to the total number of cases given in each column.
Abbreviations: ATA, American Thyroid Association; BRAF(+)TERTp(–), samples with BRAF V600E and without any TERT promoter variant; BRAF(–)TERTp(+), samples without BRAF V600E and with TERT promoter hot spot variant; BRAF(+)TERTp(+), samples with BRAF V600E and a TERT promoter hot spot variant; FDR, false discovery rate; NM_PTCs, nonmutated papillary thyroid cancers (samples without BRAF V600E and without any TERT promoter variant); TERTp non–hot spot, samples with a non–hot spot TERT promoter variant | |||||||||||||
Total number of cases | 92 (100) | 74 (100) | – | – | 3 (100) | – | – | 13 (100) | – | – | 6 (100) | – | – |
Initial risk stratification according to ATA guidelines | |||||||||||||
Low risk | 68 (73.9) | 42 (56.8) | 0.06 | 0.14 | 3 (100) | >0.99 | >0.99 | 2 (15.4) | <0.001 | <0.001 | 4 (66.7) | 0.34 | 0.45 |
Intermediate risk | 12 (13) | 18 (24.3) | 0 | 3 (23.1) | 0 | ||||||||
High risk | 12 (13) | 14 (18.9) | 0 | 8 (61.5) | 2 (33.3) | ||||||||
Persistent disease | |||||||||||||
Yes | 6 (6.6) | 17 (23.3) | 0.003 | 0.01 | 1 (33.3) | 0.21 | 0.34 | 5 (41.7) | 0.003 | 0.01 | 1 (16.7) | 0.37 | 0.47 |
No | 85 (93.4) | 56 (76.7) | 2 (66.7) | 7 (58.3) | 5 (83.3) | ||||||||
Missing data | 1 | 1 | 0 | 1 | 0 | ||||||||
Recurrence | |||||||||||||
Yes | 2 (2.2) | 6 (8.2) | 0.14 | 0.28 | 1 (33.3) | 0.09 | 0.21 | 6 (46.2) | <0.001 | <0.001 | 0 | >0.99 | >0.99 |
No | 89 (97.8) | 67 (91.8) | 2 (66.7) | 7 (53.8) | 6 (100) | ||||||||
Missing data | 1 | 1 | 0 | 0 | 0 | ||||||||
Radioactive iodine treatment | |||||||||||||
Yes | 45 (49.5) | 58 (78.4) | <0.001 | 0.001 | 3 (100) | 0.24 | 0.34 | 12 (92.3) | 0.005 | 0.02 | 4 (66.7) | 0.68 | 0.81 |
No | 46 (50.5) | 16 (21.6) | 0 | 1 (7.7) | 2 (33.3) | ||||||||
Missing data | 1 | 0 | 0 | 0 | 0 | ||||||||
Response to treatment according to ATA guidelines | |||||||||||||
Excellent | 82 (90.1) | 65 (87.8) | 0.71 | 0.81 | 1 (33.3) | 0.02 | 0.054 | 3 (23.1) | <0.001 | <0.001 | 5 (83.3) | 0.23 | 0.34 |
Indeterminate | 7 (7.7) | 5 (6.8) | 1 (33.3) | 1 (7.7) | 0 | ||||||||
Biochemical incomplete | 1 (1.1) | 3 (4.1) | 0 | 5 (38.5) | 0 | ||||||||
Structural incomplete | 1 (1.1) | 1 (1.4) | 1 (33.3) | 4 (30.8) | 1 (16.7) | ||||||||
Missing data | 1 | 0 | 0 | 0 | 0 | ||||||||
Follow‑up duration, mo | 75.5 (61–94) | 81.5 (63.8–87.8) | 0.81 | 0.88 | 33 (26–65) | 0.23 | 0.34 | 71 (48–84) | 0.15 | 0.28 | 92.5 (88.2–98.2) | 0.052 | 0.14 |
No significant differences were observed between BRAF(–)TERTp(+) samples and NM_PTCs. Although BRAF(–)TERTp(+) samples showed a poorer response to treatment according to the ATA guidelines7 (unadjusted P = 0.02), this difference did not remain substantial after adjustment for multiple comparisons (FDR‑adjusted P = 0.054).
The coexistence of BRAF V600E variant and TERTp hot spot variants was associated with several clinical factors, as compared with PTCs in which no BRAF/TERTp variants were detected (NM_PTCs; Table 1). These factors included higher initial risk stratification according to the ATA guidelines (unadjusted P <0.001; FDR‑adjusted P <0.001), persistent disease (defined as the presence of any structural disease detected by RAI whole‑body scan or other imaging studies up to 12 months after primary surgery due to TC; unadjusted P = 0.003; FDR‑adjusted P = 0.01), RAI treatment (unadjusted P = 0.005; FDR‑adjusted P = 0.02), poorer response to treatment according to the ATA guidelines (unadjusted P <0.001; FDR‑adjusted P <0.001), and recurrences (defined as detection of structural disease or a new lesion more than 12 months after primary surgery due to TC, in patients with and without persistent disease; unadjusted P <0.001; FDR‑adjusted P <0.001).
No significant differences were observed when comparing TERTp non–hot spot PTCs with NM_PTCs. However, it should be emphasized that the analysis was based on a small sample size in this group (n = 6).
Time‑to‑progression analysis
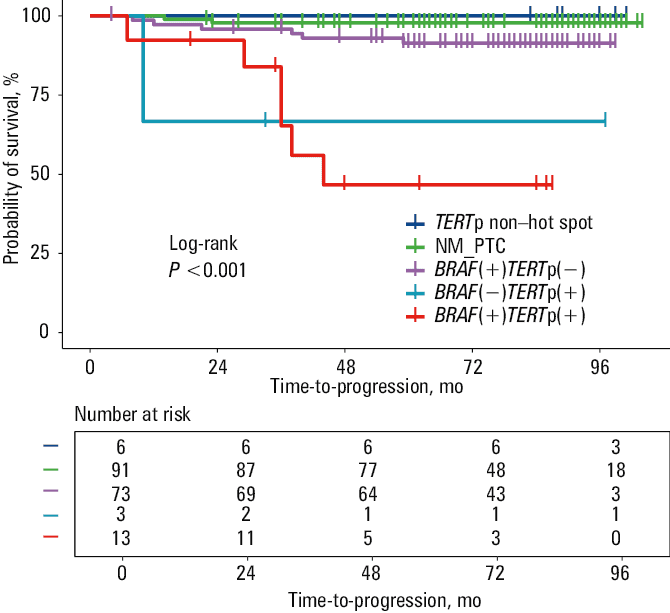
Time‑to‑progression analysis was performed in 186 patients (out of 188), after exclusion of 2 patients with missing recurrence data. The analysis, using the Kaplan–Meier estimation and log‑rank test, revealed an association between PTC mutational status (defined by BRAF V600E and TERTp hot spot variants) and time‑to‑progression (P <0.001; Figure 1). The BRAF(+)TERTp(+) patients had a shorter time‑to‑progression than the BRAF(+)TERTp(–) ones (unadjusted P <0.001; FDR‑adjusted P <0.001) and those with NM_PTCs (unadjusted P <0.001; FDR‑adjusted P <0.001; Table 2). The log‑rank test also revealed a shorter time‑to‑progression in BRAF(–)TERTp(+) PTCs than NM_PTCs (unadjusted P <0.001; FDR‑adjusted P = 0.001; Table 2). However, the bootstrap‑based log‑rank test did not confirm a marked difference in this case (unadjusted P = 0.14; FDR‑adjusted P = 0.14; Table 2). Therefore, this result should be interpreted with caution.
Abbreviations: see Table 1
Comparison type | Log‑rank test | Bootstrap‑based log‑rank test | ||||
Unadjusted P value | FDR‑adjusted P value | Unadjusted P value | FDR‑adjusted P value | |||
Abbreviations: see Table 1 | ||||||
BRAF(+)TERTp(+) (n = 13) | vs | NM_PTCs (n = 91) | <0.001 | <0.001 | 0.002 | 0.01 |
BRAF(–)TERTp(+) (n = 3) | vs | NM_PTCs (n = 91) | <0.001 | 0.001 | 0.14 | 0.14 |
BRAF(+)TERTp(–) (n = 73) | vs | NM_PTCs (n = 91) | 0.08 | 0.1 | 0.11 | 0.14 |
TERTp non–hot spot (n = 6) | vs | NM_PTCs (n = 91) | 0.71 | 0.71 | 0.1 | 0.14 |
BRAF(+)TERTp(+) (n = 13) | vs | BRAF(+)TERTp(–) (n = 73) | <0.001 | <0.001 | 0.007 | 0.02 |
We also performed univariable and multivariable analyses using the Cox regression method to assess the impact of various factors (TERTp hot spot variant, BRAF V600E variant, age at diagnosis, and sex) on recurrence risk. In the univariable analysis, all factors were significantly associated with a shorter time‑to‑progression (Table 3). However, in the multivariable analysis, only the presence of TERTp hot spot variants remained significant (hazard ratio [HR], 10.81; 95% CI, 2.7–43.28; P <0.001; Table 3).
Parameter | Univariable analysis | Multivariable analysis | ||
HR (95% CI) | P value | HR (95% CI) | P value | |
Abbreviations: HR, hazard ratio; Ref, reference group; others, see Table 1 | ||||
Age at diagnosis | 1.04 (1–1.08) | 0.049 | 0.99 (0.95–1.03) | 0.56 |
TERTp hot spot mutation | ||||
No | 1 (Ref) | 1 (Ref) | ||
Yes | 13.32 (4.78–37.15) | <0.001 | 10.81 (2.7–43.28) | <0.001 |
BRAF V600E mutation | ||||
No | 1 (Ref) | 1 (Ref) | ||
Yes | 4.63 (1.31–16.41) | 0.02 | 2.8 (0.72–10.89) | 0.14 |
Sex | ||||
Women | 1 (Ref) | 1 (Ref) | ||
Men | 3.4 (1.08–10.69) | 0.04 | 1.6 (0.48–5.39) | 0.45 |
Risk stratification with the use of TERT promoter status
We decided to employ the 2‑dimensional prognostic system, created by Kim et al,22 which uses DRS,7 alongside information about TERTp mutational status. This system has been proposed as an effective tool for recurrence risk stratification. Kim et al22 defined 4 adjusted HR (AHR) groups, which included the following patients: AHR1, patients with an excellent response and a wild‑type TERTp; AHR2, patients with an indeterminate response and a wild‑type TERTp; AHR3, patients with a biochemical / structural incomplete response and a wild‑type TERTp or an excellent / indeterminate response and a mutant TERTp; AHR4, patients with a biochemical / structural incomplete response and a mutant TERTp. Due to the low number of cases and the low number of recurrent events in some AHR groups, AHR1 and AHR2 were combined into a single AHR1/2 group, and AHR3 and AHR4 were combined into the AHR3/4 group for further analysis. Taking into account the presence of TERTp variants and treatment response, we compared the AHR1/2 groups (patients with PTC negative for TERTp variants with an excellent or indeterminate response) with the AHR3/4 groups, which included TERTp‑positive cases and cases with incomplete response. The recurrence rate was 3.2% and 45.5% in the AHR1/2 and AHR3/4 sets, respectively (unadjusted P <0.001; FDR‑adjusted P <0.001; Supplementary material, Table S3). The AHR3/4 set included a much higher percentage of patients with persistent disease than the AHR1/2 set (47.6% vs 12%), and these differences were visible even with multiple testing correction (unadjusted P <0.001; FDR‑adjusted P <0.001). The Kaplan–Meier test also showed that the time‑to‑progression was shorter for the AHR3/4 patients than for the AHR1/2 ones (P <0.001; Figure 2; Supplementary material, Figure S1). Unlike the AHR1/2 set, the AHR3/4 set consisted mainly of men (unadjusted P <0.001; FDR‑adjusted P <0.001), patients who were older at diagnosis (unadjusted P <0.001; FDR‑adjusted P <0.001), had higher PTC stage (unadjusted P <0.001; FDR‑adjusted P <0.001), lymph node metastases (unadjusted P <0.001; FDR‑adjusted P <0.001), angioinvasion (unadjusted P = 0.002; FDR‑adjusted P = 0.003), and greater tumor diameter (unadjusted P <0.001; FDR‑adjusted P <0.001).
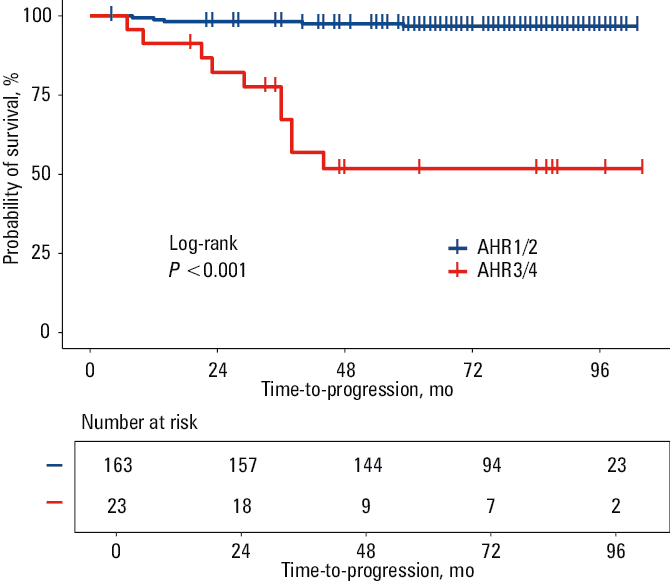
Abbreviations: AHR, adjusted hazard ratio; AHR1/2, combined AHR1 and AHR2 patient groups; AHR3/4, combined AHR3 and AHR4 patient groups
Discussion
PTC is a relatively indolent tumor; however, an aggressive course of the disease is observed in some patients. The most widely accepted and used tool for classifying differentiated TCs (DTC) is the AJCC/Union for International Cancer Control (UICC) staging system,6 which has been updated by the ATA and is supported by DRS that enables the estimation of recurrence risk throughout follow‑up of DTC patients.7 Nevertheless, none of the risk stratification systems in use considers all potential factors that may impact long‑term prognosis. Several genetic alterations have been associated with PTC; however, their use as prognostic factors is still being evaluated. Although the detection of BRAF V600E and TERTp variants is not routinely recommended as a prognostic molecular marker, these genetic alterations may refine recurrence risk estimation when considered alongside clinical‑pathological features. While the use of BRAF V600E as a prognostic marker is controversial,23 TERTp variants have been shown to be strongly related to the aggressiveness of TCs.24,25 They are most prevalent in poorly differentiated and anaplastic TCs and least prevalent in small thyroid cancers.26,27 Melo et al28 demonstrated their independent prognostic role in disease‑free survival and mortality of DTC patients in 2014. While the latest European consensus on predictive biomarker testing emphasizes the importance of BRAF testing due to its therapeutic potential, little information is available regarding the use of TERTp testing for prognostication in patients with PTC.29 There are literature data suggesting certain biomarkers for predicting, for instance, RAI therapy efficacy.30 There are also studies indicating TERTp variants and BRAF V600E mutation as markers that would be informative for prognosis and treatment strategies.31 Further studies in different populations are needed, however, to evaluate the usefulness and efficiency of prognosis with particular molecular markers.
This study analyzed the usefulness of TERTp variants in the risk stratification of Polish PTC patients. A set of 188 PTCs corresponding to the typical clinical presentation of the Polish PTC population was studied. As reported in our previous study, 8.5% of the cases in this cohort were TERTp(+) PTCs and 47% were BRAF(+) PTCs.19 Three out of 16 TERTp(+) PTCs harbored only a TERTp variant, without a coexisting BRAF V600E alteration. Although the BRAF and TERTp mutational statuses were established long after the patients had received treatment, we observed a positive association between their presence and higher initial risk stratification, as well as RAI treatment. This observation confirms the results of previous studies that showed a higher frequency of these alterations in more advanced PTC tumors.32 However, we also demonstrated that BRAF(+)TERTp(+) PTCs had significantly higher recurrence rates and poorer response to treatment than BRAF(+)TERTp(–) PTCs. Our results are in line with those of other studies that have produced similar data.33 We cannot definitively determine whether recurrences and poorer responses to treatment are related to the presence of TERTp variants alone or to the coexistence of these 2 genetic alterations. Indeed, the number of recurrent cases in our PTC cohort was small. Nevertheless, PTCs with only TERTp hot spot variants and BRAF(+)TERTp(+) cases showed significant differences in relapse time, as compared with PTCs without these alterations, as demonstrated by the log‑rank test and Kaplan–Meier time‑to‑progression curve. The Cox regression analysis showed that, in a multivariable analysis, only the TERTp variants were significantly associated with the higher risk of recurrence; BRAF V600E, age at diagnosis, and sex were not. A similar analysis was performed by Bullock et al34 in 2016. However, in their multivariable analysis, only stage IV disease was found to be significantly associated with lower disease‑free survival.
While PTCs are indolent in most cases, there is no doubt that effective risk stratification is needed so that patients receive adequate treatment. As many as 10% of PTC cases develop distant metastases, which are the main clinical feature reliably associated with a poorer outcome in PTC patients. The TERTp hot spot variants have been shown to be associated with the presence of distant metastases in PTCs.35,36 Together with the abovementioned data, this makes the TERTp variants a possible future tool for predicting aggressive behavior in PTCs. Kim et al22 proposed using TERTp mutational status alongside the DRS approach recommended by ATA as an effective system for predicting structural recurrence and providing clinical implications for long‑term cancer‑specific survival. This protocol is intended for patients with nonmetastatic DTCs.22 In our analysis, we used the AHR grouping created by Kim et al,22 with a slight modification. Rather than comparing each group individually, we combined the 4 groups according to the TERTp mutational status and treatment response, obtaining 2 sets: the AHR1/2 set comprising TERTp‑nonmutated cases, and the AHR3/4 set comprising cases positive for TERTp variant and / or incomplete response. We observed an association between the AHR grouping and histopathological features, as well as time‑to‑progression. The AHR3/4 set consisted of more advanced PTC cases with a larger tumor diameter, a higher percentage of lymph node metastases, angioinvasion, persistent disease, and recurrence in comparison with the AHR1/2 set. Furthermore, approximately half of the AHR3/4 group were men, and the median age at diagnosis was significantly higher than in the AHR1/2 group. According to the initial ATA risk stratification, 7 out of 22 AHR3/4 cases (31.8%) were initially classified as low‑risk PTCs. However, the presence of TERTp variants meant they were reclassified as being at the highest risk of recurrence. A more prudent approach to monitoring and follow‑up should be considered for such patients. The results obtained and the data published so far suggest that TERTp variants are important in predicting clinical outcomes and responses to treatment in patients with TC.37 Although there are no strong recommendations for routinely detecting TERTp variants, this should be considered in risk stratification to identify and adequately manage high‑risk patients.
Limitations
Our study has some limitations, mainly concerning the small size of the analyzed PTC subgroups, especially BRAF(+)TERTp(+) (n = 13) and BRAF(–)TERTp(+) (n = 3) tumors. As mentioned earlier, the PTC panel used in this study reflects typical clinical features of PTC in the Polish population, and overall, PTC harbors TERTp variants in a small percentage of cases. This is reflected in the small number of PTC cases with an aggressive course. Nevertheless, the percentage of TERTp‑positive cases was sufficient to suggest an association with a higher risk of relapse. A similar percentage of TERTp variants is observed in other populations.37 Further studies are needed to determine whether this risk is due to the presence of TERTp variants alone or in combination with BRAF V600E. Another limitation is the method used to detect BRAF and TERTp variants, that is, Sanger sequencing, which has a detection limit of 10%–20% of the variant allele frequency. We are aware that the use of formalin‑fixed, paraffin‑embedded material and the Sanger method may lead to some false‑negative results. However, during the laboratory work for this study, the Sanger method was the gold standard for variant detection, and the quality parameters of all samples tested allowed for performing the analysis. Although more sensitive methods, such as quantitative polymerase chain reaction (PCR) or droplet digital PCR are currently used, Sanger sequencing remains the most widely used technique for detecting these variants in many laboratories.
Clinical data were assessed according to the 2015 ATA recommendations,7 which were current at the time of the analyses. On the one hand, this can be considered a limitation of our study, but on the other hand, it allowed for reference to previous studies in the context of the association of TERTp variants with risk stratification.
Conclusions
In the era of personalized oncology and growing knowledge of the molecular basis of cancer, we find that a “one‑size‑fits‑all” treatment strategy is ineffective due to overtreatment or underestimation of risk. Patients with PTC also require a more personalized approach. The risk stratification methods currently used to treat patients with PTC have many limitations and should be supported by the use of molecular markers. The association of TERTp variants with distant metastases and disease recurrence in patients with PTC seems undeniable. This was also confirmed in our study. We should consider detecting TERTp variants in routine diagnostic procedures, since this could significantly improve our ability to classify patients into particular risk groups and enable us to plan treatment and follow‑up properly.
- Carcangiu ML, Zampi G, Rosai J. Papillary thyroid carcinoma: a study of its many morphologic expressions and clinical correlates. Pathol Annu. 1985; 20 Pt 1: 1‑44.
- McConahey WM, Hay ID, Woolner LB, et al. Papillary thyroid cancer treated at the Mayo Clinic, 1946 through 1970: initial manifestations, pathologic findings, therapy, and outcome. Mayo Clin Proc. 1986; 61: 978‑996. | Crossref
- Ito Y, Miyauchi A, Kihara M, et al. Overall survival of papillary thyroid carcinoma patients: a single‑institution long‑term follow‑up of 5897 patients. World J Surg. 2018; 42: 615‑622. | Crossref
- Hay ID, Thompson GB, Grant CS, et al. Papillary thyroid carcinoma managed at the Mayo Clinic during six decades (1940‑1999): temporal trends in initial therapy and long‑term outcome in 2444 consecutively treated patients. World J Surg. 2002; 26: 879‑885. | Crossref
- Sippel RS, Chen H. Controversies in the surgical management of newly diagnosed and recurrent / residual thyroid cancer. Thyroid. 2009; 19: 1373‑1380. | Crossref
SUPPLEMENTARY MATERIAL
ARTICLE INFORMATION