
Lipoprotein(a) and clinical outcomes after transcatheter aortic valve implantation: a prospective, multicenter cohort study
Key words: aortic stenosis, biomarker, lipoprotein(a), risk factor, TAVI


 CC BY-NC-SA 4.0
Lipoprotein(a) and clinical outcomes after transcatheter aortic valve implantation: a prospective, multicenter cohort study
CC BY-NC-SA 4.0
Introduction: Severe aortic stenosis (AS) can be treated with transcatheter aortic valve implantation (TAVI). There is emerging evidence suggesting that high lipoprotein(a) (Lp[a]) levels may be associated with worse outcomes after TAVI.
Objectives: We aimed to compare major adverse cardiac and cerebrovascular events (MACCEs) within 12 months after TAVI and long‑term survival in patients with high and low Lp(a) levels.
Patients and methods: In this prospective, multicenter cohort study we included patients with severe AS qualified for TAVI with stored plasma available for Lp(a) measurement. The patients were stratified into high- and low‑Lp(a) groups (cutoff, 30 mg/dl). Two primary end points were 12‑month MACCE and long‑term overall survival. Secondary end points were individual components of MACCE.
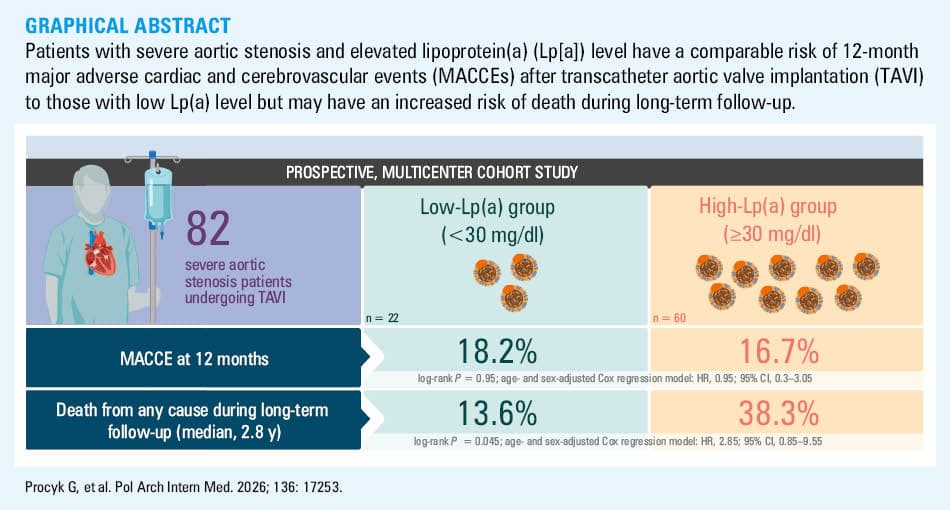
Results: Between November 2018 and September 2021, TAVI was performed across 3 clinical sites; stored plasma was available for Lp(a) level measurement in 82 patients. We observed no difference in MACCE occurrence in the high- and low‑Lp(a) groups. In unadjusted analyses, the patients with elevated Lp(a) levels had worse long‑term survival during median follow‑up of 2.8 years (log‑rank P = 0.045) but this difference lost significance after adjustments for age and sex in a Cox regression model (hazard ratio, 2.85; 95% CI, 0.85–9.55; P = 0.054). None of the secondary end points differed significantly between the groups.
Conclusions: The patients with elevated Lp(a) level had a comparable risk of 12‑month MACCE after TAVI to those with low Lp(a) level but might have worse long‑term survival. Long‑term findings should be considered exploratory and require further confirmation.
What's new?
Elevated lipoprotein(a) [Lp(a)] level is an independent risk factor for atherosclerotic cardiovascular disease and aortic stenosis. There is emerging evidence suggesting that high Lp(a) levels are associated with worse outcomes after transcatheter aortic valve implantation (TAVI). To the best of our knowledge, this is the first study with 12‑month follow‑up on major adverse cardiac and cerebrovascular events (MACCEs) and Lp(a) levels after TAVI. We did not observe any differences in the composite MACCE end point or in any of its individual components. However, we found that patients with elevated Lp(a) levels had worse overall survival after TAVI during long‑term follow‑up in unadjusted analysis.
Introduction
Aortic stenosis (AS) is the most common valvular heart disease requiring intervention.1 Severe AS, particularly when symptomatic, is a progressive condition associated with a poor prognosis.2 It affects 3%–4% of individuals aged 75 years and older, and its prevalence is predicted to increase due to an aging population.3 Severe AS typically requires either a surgical aortic valve replacement (SAVR) or transcatheter aortic valve implantation (TAVI).4 According to the 2025 European Society of Cardiology (ESC) and European Association for Cardio‑Thoracic Surgery (EACTS) guidelines for the management of valvular heart disease,4 TAVI is recommended in patients aged 70 years and older with tricuspid aortic valve stenosis, if the anatomy is suitable, while SAVR is recommended in patients below 70 years of age, if the surgical risk is low. In all other cases, a careful assessment by a heart team is indicated. Prognostic factors for both short- and long‑term outcomes after TAVI and SAVR are essential to aid decision‑making, especially in patients at the borderline of eligibility for either procedure.5
Lipoprotein(a) [Lp(a)] is a low‑density lipoprotein–like lipoprotein particle and an independent, causal risk factor for atherosclerotic cardiovascular disease.6 Lp(a) levels are predominantly (>90%) determined by genetics.7 The results of ongoing clinical trials assessing the impact of Lp(a)-targeted drugs on lowering adverse cardiovascular events, such as Lp(a)HORIZON (Assessing the Impact of Lipoprotein[a] Lowering With Pelacarsen [TQJ230] on Major Cardiovascular Events in Patients With CVD)8 and OCEAN(a)-Outcomes (A Double‑blind, Randomized, Placebo‑controlled, Multicenter Study Assessing the Impact of Olpasiran on Major Cardiovascular Events in Participants with Atherosclerotic Cardiovascular Disease and Elevated Lipoprotein[a])9 are widely anticipated. Although no specific therapy for high Lp(a) levels has yet been registered, it is important to identify individuals with an elevated Lp(a) level to optimize the management of other modifiable cardiovascular risk factors.10,11 The 2025 focused update of the 2019 ESC/European Atherosclerosis Society (EAS) guidelines for the management of dyslipidemias recommends measuring Lp(a) levels at least once in a lifetime in all adults, and an Lp(a) concentration above 50 mg/dl should be considered as a cardiovascular risk–enhancing factor.12 Furthermore, the 2022 EAS Consensus Statement identified elevated Lp(a) level as a new risk factor for aortic valve stenosis.13 There are emerging data suggesting that high Lp(a) levels are associated with worse outcomes after TAVI14-16; however, the available evidence remains limited.
The aim of this study was to compare the occurrence of major adverse cardiac and cerebrovascular events (MACCEs) within 12 months after TAVI, and long‑term survival in patients with high and low Lp(a) levels.
Patients and methods
Study design
In this prospective, multicenter cohort study, we evaluated the clinical outcomes after TAVI according to Lp(a) concentration. The patients were stratified into high- and low‑Lp(a) groups using a prespecified cutoff of 30 mg/dl consistent with recent TAVI data.15 Additional thresholds were explored in sensitivity analyses, as described below.
The study protocol was approved by the Ethics Committee at the Medical University of Warsaw (KB/128/2018, KB/4/A2021). Written informed consent was obtained from each study participant.
Patients
The patients with severe AS (aortic valve area <1 cm2 or indexed aortic valve area <0.6 cm2/m2) who were qualified for TAVI by a local heart team were prospectively enrolled across 3 centers. Dobutamine stress echocardiography was performed to distinguish true‑severe from pseudo‑severe AS in patients with low‑flow, low‑gradient AS and reduced left ventricular ejection fraction (LVEF). Aortic calcium score was measured on computed tomography in the patients with low‑flow, low‑gradient AS and preserved LVEF.
The patients were excluded if they were scheduled for a valve‑in‑valve procedure, had chronic kidney disease (estimated glomerular filtration rate <30 ml/min/1.73 m2), autoimmune disease, active neoplastic disease, or were pregnant or breast‑feeding. For the present analysis, Lp(a) level was measured only in the patients with an available stored plasma sample suitable for testing; therefore, the final analytic cohort comprised 82 individuals.
Procedure, hospitalization, and follow‑up
All patients underwent TAVI performed by an interventional cardiologist assisted by a cardiothoracic surgeon. Antithrombotic therapy was prescribed according to the 2017 ESC/EACTS guidelines for the management of valvular heart disease, which were binding at the time of enrollment.17 Other drugs were prescribed at the discretion of the treating physician.
Patient baseline data were collected at the time of the index hospitalization. Blood samples from each patient were collected and double‑centrifuged (2500 g, 15 min, 20 C) to obtain platelet‑depleted plasma that was stored at –20 C until further analyses. Lipoprotein(a) level was measured with enzyme‑linked immunosorbent assay (ELISA; ab212165, Abcam, Cambridge, United Kingdom). Absorbance was read at 450 nm, with 570 nm as the reference wavelength for correction. Sample concentrations were calculated from an 8‑point serial dilution standard curve (including blank) fitted using linear regression and corrected for the dilution factor.
MACCEs were recorded during the follow‑up visit scheduled approximately 1 year after the procedure. Long‑term survival follow‑up was completed on November 12, 2023. Data were obtained from medical records and telephone interviews.
Clinical end points
Two primary end points were evaluated in this study. The first was MACCE, defined as a nonhierarchical composite of all‑cause death, myocardial infarction, stroke, transient ischemic attack, heart failure (HF) worsening, valve reintervention, or valve thrombosis, truncated at 12 months. The components of MACCE were defined with reference to standardized definitions.18,19 HF worsening was defined as a sudden or rapid exacerbation of HF signs and symptoms, requiring medical attention (outpatient intensification of diuretic therapy or hospitalization).
The second primary end point was overall survival truncated at the common longest follow‑up time in both groups. Secondary end points in this study were the individual components of the first primary composite end point.
Subgroup analysis
Subgroup analyses for the primary end points were performed according to sex, body mass index (<27 kg/m2 vs ≥27 kg/m2), atrial fibrillation, chronic kidney disease, diabetes mellitus, age (<85 y vs ≥85 y), New York Heart Association class (I–II vs III–IV), and history of stroke.
Statistical analysis
Continuous variables were presented as mean (SD) or median (interquartile range [IQR]), as appropriate. Categorical variables were presented as count (percentage). Differences between the groups were calculated using the t test or Wilcoxon rank‑sum test for continuous variables and the χ2 test or Fisher exact test for categorical variables, as appropriate.
The primary end points were analyzed using the Kaplan–Meier time‑to‑event curves and compared between the Lp(a) groups with the log‑rank test. Sensitivity analyses included exclusion of periprocedural events (≤30 days) and redefinition of Lp(a) cutoff to 50 and 75 mg/dl. Additionally, Cox proportional hazards models adjusted for age and sex were used to analyze the primary end points. Unadjusted Cox proportional hazards models were fitted for the secondary end points and for the subgroup analyses. P values for interaction between the subgroups and P values for all Cox proportional hazards models were derived from the likelihood ratio test. Given the limited sample size and statistical power, the subgroup analyses, sensitivity analyses, and multivariable Cox regression analyses should be considered exploratory and hypothesis‑generating. For all analyses, a P value below 0.05 was considered significant.
All statistical analyses were performed with R software, version 4.5.2 (R Foundation for Statistical Computing, Vienna, Austria).
Results
Patients and procedures
From November 2018 to September 2021, TAVI was performed across 3 clinical sites. However, Lp(a) levels could only be assessed if an adequate stored plasma sample was available, which yielded an analytic cohort of 82 patients. Of these, 60 had high Lp(a) concentration (≥30 mg/dl) and 22 had low Lp(a) concentration (<30 mg/dl). The baseline characteristics of the patients are presented in Table 1. Median (IQR) age of the patients was 80 (75–83) years, 51.2% were men, and median EuroSCORE II score was 3.6 (2.5–4.7). Median follow‑up time was 2.8 (2.1–3.8) years and the maximum follow‑up time was 4.7 years. The patients in the high‑Lp(a) group had higher concentrations of total cholesterol (TC; P = 0.03) and lower concentrations of triglycerides (P = 0.049) than the patients in the low‑Lp(a) group.
Parameter | All patients (n = 82) | Low Lp(a) (n = 22) | High Lp(a) (n = 60) | P value |
Continuous variables are presented as mean (SD) or median (interquartile range), as appropriate. Categorical variables are presented as number (percentage).
SI conversion factors: to convert HDL‑C, LDL‑C, and TC to mmol/l, multiply by 0.02586; triglycerides to mmol/l, by 0.01129; hemoglobin to g/l, by 10; creatinine to μmol/l, by 88.4.
Abbreviations: AVA, aortic valve area; BMI, body mass index; CABG, coronary artery bypass grafting; CKD, chronic kidney disease; COPD, chronic obstructive pulmonary disease; CRP, C‑reactive protein; eGFR, estimated glomerular filtration rate; HDL‑C, high‑density lipoprotein cholesterol; LDL‑C, low‑density lipoprotein cholesterol; Lp(a), lipoprotein(a); LVEF, left ventricular ejection fraction; MI, myocardial infarction; NT‑proBNP, N‑terminal pro–B‑type natriuretic peptide; NYHA, New York Heart Association; PCI, percutaneous coronary intervention; TIA, transient ischemic attack; TC, total cholesterol; Vmax, maximum velocity; WBC, white blood cell count | ||||
Demographics | ||||
Age, y | 80 (75–83) | 79 (74.2–83) | 80 (75–83) | 0.65 |
Women | 40 (48.8) | 13 (59.1) | 27 (45) | 0.26 |
BMI, kg/m2 | 27.4 (24.5–31.4) | 27.4 (25.2–31.7) | 27.4 (24.5–31) | 0.79 |
NYHA class | ||||
I | 1 (1.2) | 0 | 1 (1.7) | 0.92 |
II | 41 (50) | 12 (54.5) | 29 (48.3) | |
III | 38 (46.3) | 10 (45.5) | 28 (46.7) | |
IV | 2 (2.4) | 0 | 2 (3.3) | |
Clinical history and comorbidities | ||||
History of MI | 22 (26.8) | 4 (18.2) | 18 (30) | 0.28 |
History of PCI | 34 (41.5) | 7 (31.8) | 27 (45) | 0.28 |
History of CABG | 7 (8.5) | 1 (4.5) | 6 (10) | 0.67 |
History of stroke/TIA | 7 (8.5) | 2 (9.1) | 5 (8.3) | >0.99 |
Atrial fibrillation | 37 (45.1) | 12 (54.5) | 25 (41.7) | 0.3 |
CKD | 18 (22) | 5 (22.7) | 13 (21.7) | >0.99 |
Diabetes mellitus | 30 (36.6) | 9 (40.9) | 21 (35) | 0.62 |
Hypertension | 67 (81.7) | 19 (86.4) | 48 (80) | 0.75 |
COPD | 12 (14.6) | 3 (13.6) | 9 (15) | >0.99 |
Echocardiography findings | ||||
LVEF, % | 55.5 (44.8–60.2) | 60 (50–62) | 55 (43–60) | 0.24 |
Vmax, m/s | 4.1 (0.5) | 3.9 (0.6) | 4.1 (0.5) | 0.39 |
Max gradient, mm Hg | 69.5 (21.5) | 67.3 (18) | 70.2 (22.6) | 0.59 |
Mean gradient, mm Hg | 41 (29.8–49) | 42 (33–47) | 41 (29.3–49) | 0.86 |
AVA, cm² | 0.8 (0.6–0.8) | 0.8 (0.7–0.9) | 0.7 (0.6–0.8) | 0.24 |
Laboratory findings | ||||
TC, mg/dl | 144.7 (34.3) | 128.2 (26.1) | 149.4 (35.2) | 0.03 |
HDL‑C, mg/dl | 51.1 (12.8) | 47.2 (10.5) | 52.2 (13.3) | 0.18 |
LDL‑C, mg/dl | 77 (30.6) | 64.1 (23.9) | 80.7 (31.5) | 0.06 |
Non–HDL‑C, mg/dl | 90.9 (31.5) | 77.1 (22.2) | 96.7 (33.4) | 0.06 |
Triglycerides, mg/dl | 100 (81–129) | 137 (91–144.5) | 99 (74.2–124) | 0.049 |
Hemoglobin, g/dl | 12.7 (11.5–13.6) | 12.9 (11.7–13.4) | 12.6 (11.5–13.7) | 0.75 |
WBC, × 103/µl | 7 (1.4) | 7.1 (1.4) | 7 (1.5) | 0.75 |
Platelets, × 103/µl | 181.5 (153.2–219) | 182.5 (157.5–203) | 181.5 (148.8–220.8) | 0.79 |
Creatinine, mg/dl | 1.1 (0.9–1.4) | 1.1 (0.9–1.4) | 1.2 (0.9–1.4) | 0.65 |
eGFR, ml/min/1.73 m2 | 55 (19.7) | 58.7 (19.4) | 53.7 (19.8) | 0.31 |
NT‑proBNP, pg/ml | 2245 (852.5–3809.5) | 1998 (1550.2–3730.8) | 2310 (803–3809.5) | 0.88 |
CRP, mg/l | 1.4 (0.2–4.3) | 1.2 (0.2–3.7) | 1.4 (0.4–5) | 0.46 |
Cardiac operative risk | ||||
EuroSCORE II | 3.6 (2.5–4.7) | 3.2 (2.1–3.8) | 3.7 (2.5–4.9) | 0.18 |
Follow‑up duration | ||||
Follow‑up, y | 2.8 (2.1–3.8) | 3 (2.5–3.8) | 2.6 (1.8–3.8) | 0.21 |
Information on the type of implanted valves and access routes is shown in Supplementary material, Table S1, with no differences between the study groups. Paravalvular leak was the most common periprocedural complication (Supplementary material, Table S2). Medications at discharge were also similar in both groups (Supplementary material, Table S3).
Primary end points
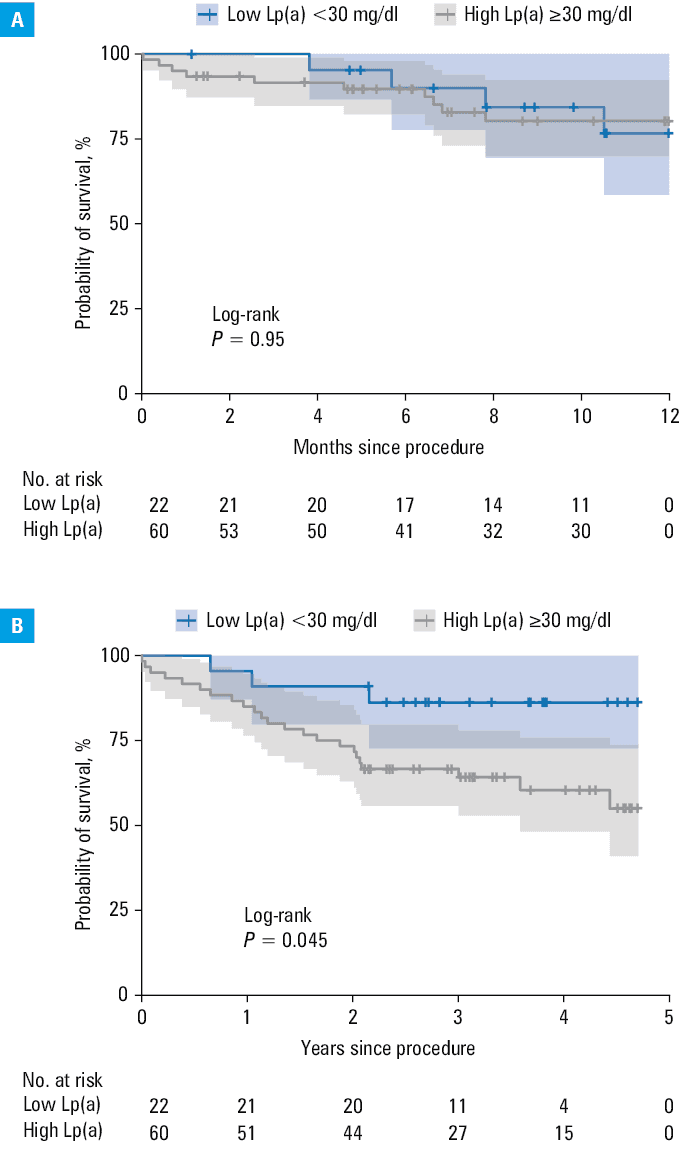
In the period from baseline to 12 months, MACCEs occurred in 4 of 22 patients (18.2%) in the low‑Lp(a) group and in 10 of 60 patients (16.7%) in the high‑Lp(a) group (log‑rank P = 0.95; Figure 1A). No marked difference regarding MACCEs was found between the groups in a Cox regression model adjusted for age and sex (hazard ratio [HR], 0.95; 95% CI, 0.3–3.05; P = 0.93; Table 2).
Abbreviations: IQR, interquartile range; MACCE, major adverse cardiac and cerebrovascular event
End point | Total (n = 82) | High Lp(a) (n = 60) | Low Lp(a) (n = 22) | HR (95% CI) | P value |
Patients were divided into the low- and high‑Lp(a) groups using a threshold of 30 mg/dl. Time‑to‑event analyses were performed using Cox proportional hazards models. MACCEs (death, myocardial infarction, stroke, transient ischemic attack, heart failure worsening, reintervention, or valve thrombosis) were truncated at 12 months, and death was truncated at the common longest follow‑up time in both groups. Median follow‑up time was 2.8 years (IQR, 2.1–3.8 y). For primary end points, HR with 95% CI is presented. For secondary end points, only P values are shown. P values were calculated with the likelihood ratio test.
a Adjusted for age and sex
| |||||
Primary end points | |||||
MACCEa | 14 | 10 | 4 | 0.95 (0.3–3.05) | 0.93 |
Deatha | 26 | 23 | 3 | 2.85 (0.85–9.55) | 0.054 |
Secondary end points – MACCE components (12 months) | |||||
Death from any cause | 7 | 6 | 1 | n/a | 0.34 |
Myocardial infarction | 0 | 0 | 0 | n/a | No events |
Stroke | 1 | 1 | 0 | n/a | 0.42 |
TIA | 0 | 0 | 0 | n/a | No events |
HF worsening | 6 | 3 | 3 | n/a | 0.29 |
Reintervention | 0 | 0 | 0 | n/a | No events |
Valve thrombosis | 0 | 0 | 0 | n/a | No events |
During long‑term follow‑up (median, 2.8 [2.1–3.8] y; maximum 4.7 y), death from any cause occurred in 3 of 22 patients (13.6%) in the low‑Lp(a) group and in 23 of 60 patients (38.3%) in the high‑Lp(a) group (log‑rank P = 0.045; Figure 1B). The difference lost significance after adjustments for age and sex in a Cox regression model (HR, 2.85; 95% CI, 0.85–9.55; P = 0.054; Table 2).
Secondary end points
In the period from baseline to 12 months, death from any cause was the most common MACCE component and it occurred in 6 patients (10%) in the high‑Lp(a) group and in 1 patient (4.5%) in the low‑Lp(a) group (Table 2). The second most common secondary end point was HF worsening that occurred in 3 patients (5%) in the high‑Lp(a) group and 3 patients (13.6%) in the low‑Lp(a) group (Table 2). None of the secondary end points differed significantly between the groups (Table 2).
Subgroup analyses
Effect sizes for MACCEs were heterogeneous in the analyzed subgroups, but no significant interaction was detected (Figure 2A). Effect sizes for all‑cause death were consistent across most subgroups, except for those defined by age and prior stroke (Figure 2B). High Lp(a) level was associated with an increased risk of death in the patients younger than 85 years (HR, 8.51; 95% CI, 1.14–63.45; Figure 2B), whereas no such association was observed in those aged 85 years or older (HR, 0.54; 95% CI, 0.09–3.26; P for interaction = 0.03; Figure 2B). High Lp(a) level was also associated with a higher risk of death in the patients without prior stroke (HR, 4.73; 95% CI, 1.11–20.14; Figure 2B), while this pattern was not evident in the patients with a history of stroke (HR, 0.45; 95% CI, 0.03–7.18; Figure 2B); however, the interaction did not reach significance (P for interaction = 0.11; Figure 2B).
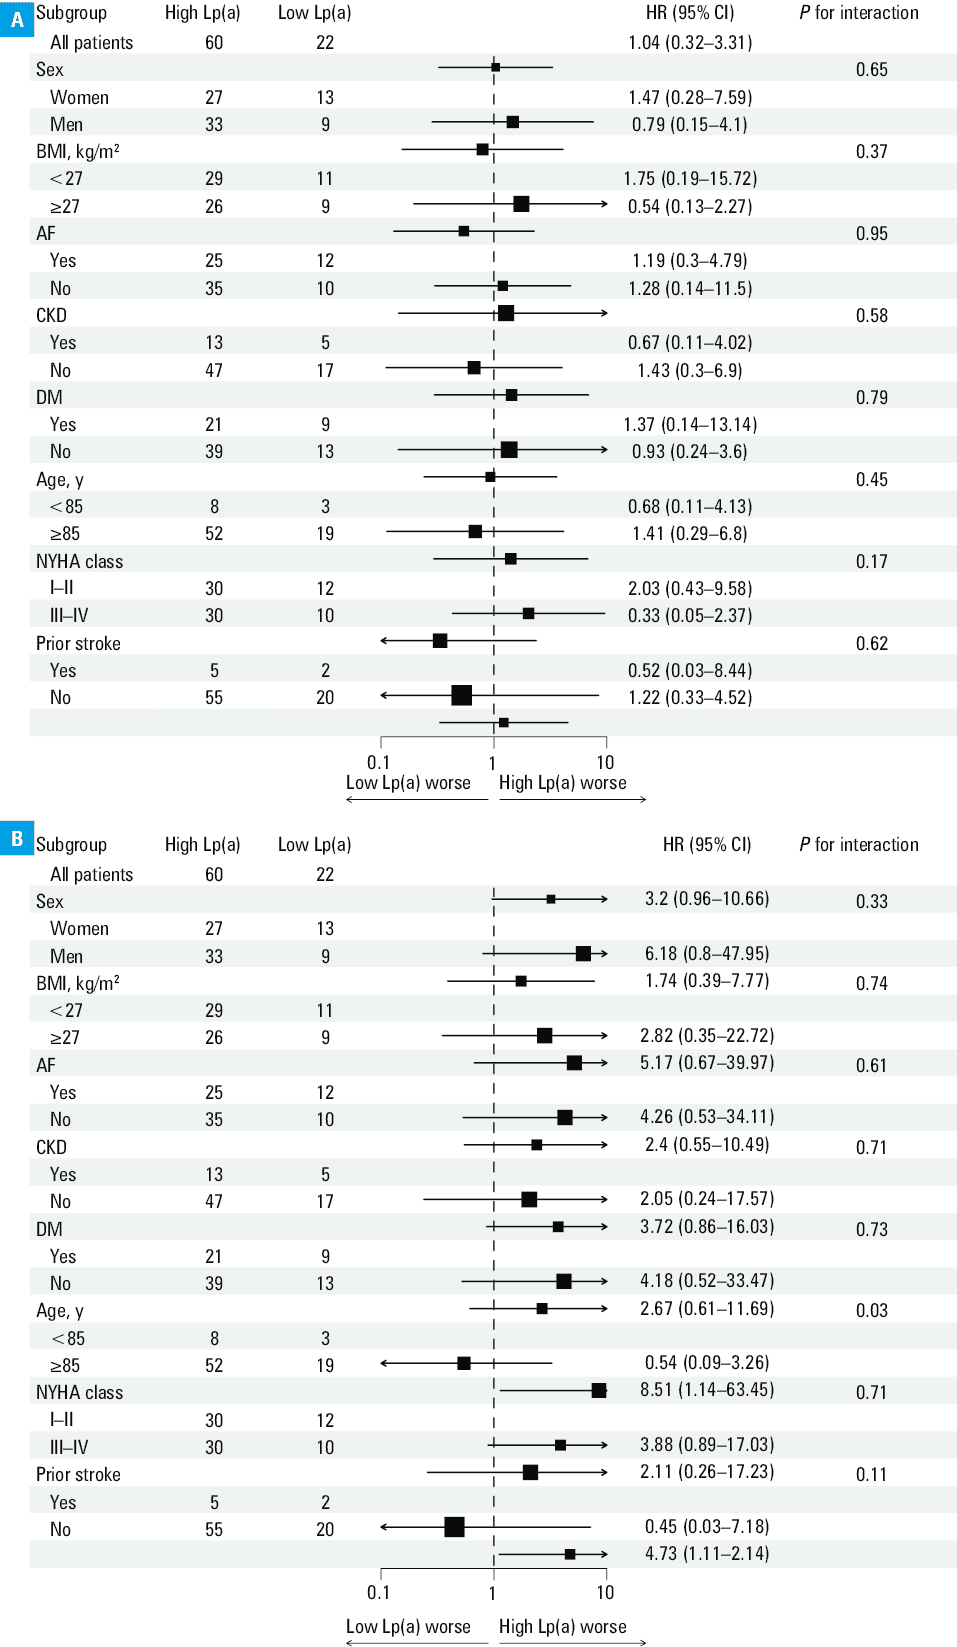
Abbreviations: AF, atrial fibrillation; DM, diabetes mellitus; see Tables 1 and 2 and Figure 1
Sensitivity analysis
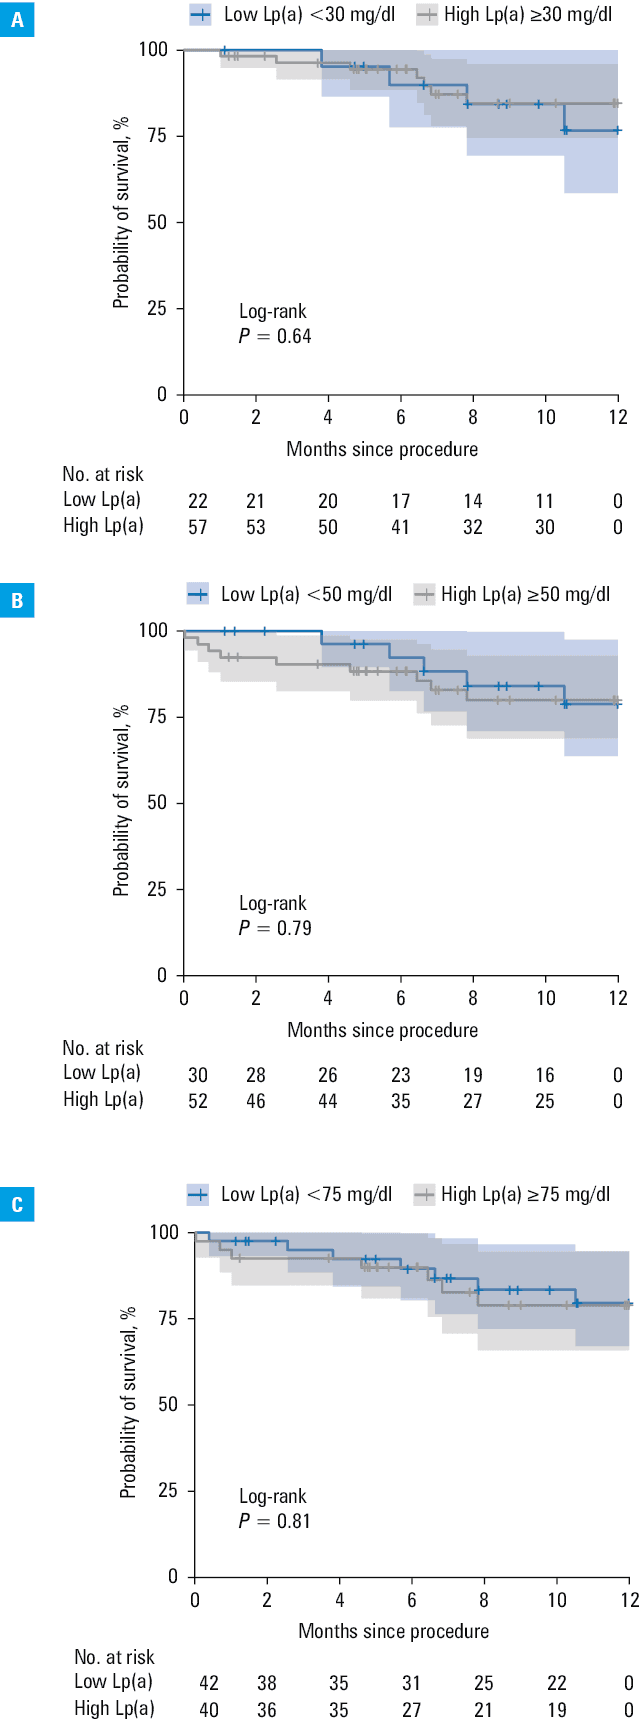
No differences in MACCE‑free survival between the high- and low‑Lp(a) groups were observed in the following sensitivity analyses: exclusion of periprocedural (≤30 days) events (log‑rank P = 0.64; Figure 3A), Lp(a) cutoff of 50 mg/dl (log‑rank P = 0.79; Figure 3B), and Lp(a) cutoff of 75 mg/dl (log‑rank P = 0.81; Figure 3C).
No differences in long‑term overall survival between the high- and low‑Lp(a) groups were observed in the following sensitivity analyses: exclusion of periprocedural (≤30 days) events (log‑rank P = 0.07; Figure 4A), Lp(a) cutoff of 50 mg/dl (log‑rank P = 0.1; Figure 4B), and Lp(a) cutoff of 75 mg/dl (log‑rank P = 0.57; Figure 4C).
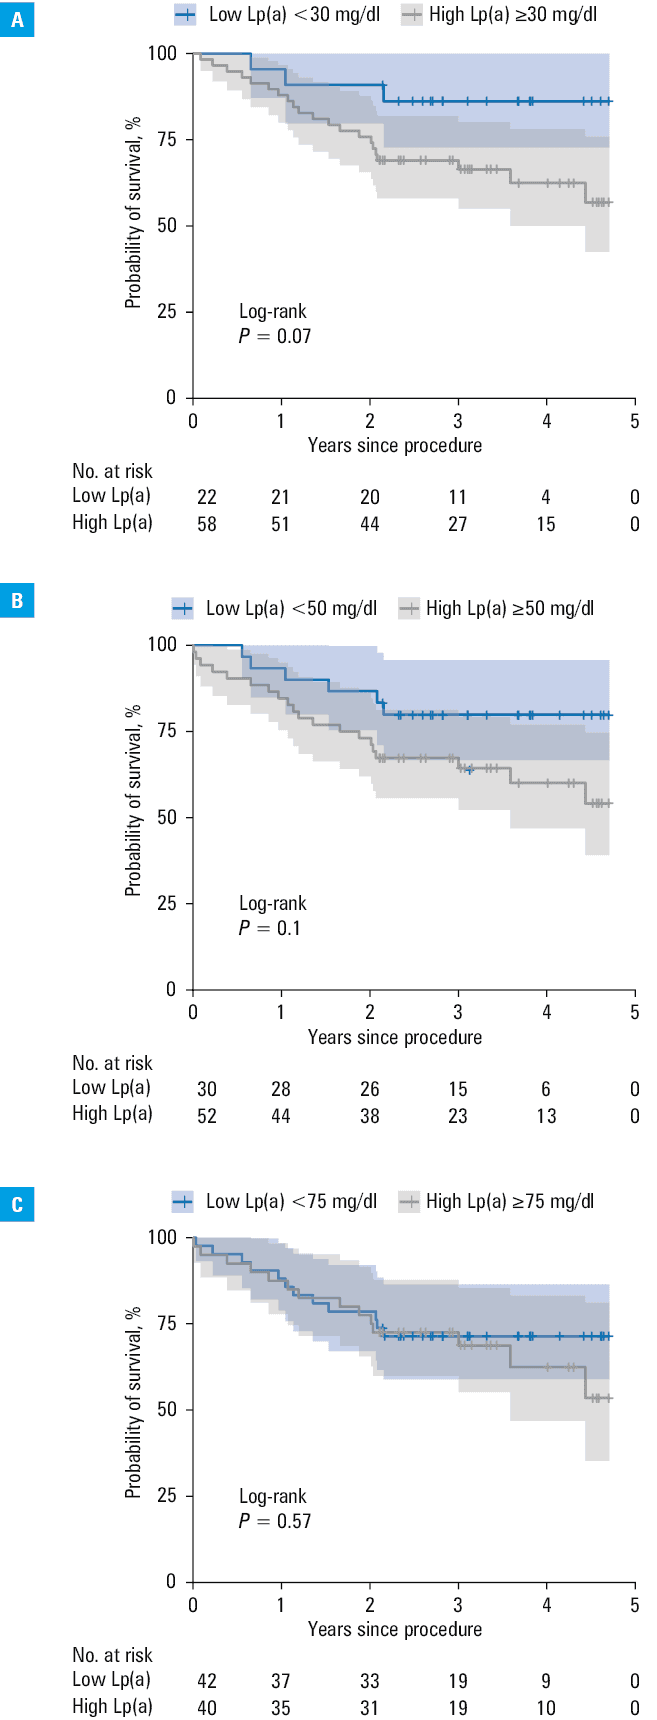
Abbreviations: see Table 1
Discussion
The main findings of our study are as follows: 1) the patients with high Lp(a) levels (≥30 mg/dl) had worse overall survival after TAVI during long‑term follow‑up in unadjusted analyses; 2) this association was more pronounced in younger patients, and may be stronger in those without a history of stroke; and 3) the risk of MACCE within 12 months after TAVI was comparable in the high- and low‑Lp(a) groups.
Existing evidence regarding the role of Lp(a) levels in patients undergoing TAVI is limited and conflicting. Bormann et al20 found no prognostic utility of Lp(a) levels for either 30‑day or 40‑month all‑cause mortality after TAVI. In contrast, Hu et al15 reported that elevated Lp(a) level was an independent predictor of all‑cause mortality over a median follow‑up of 3.9 years after TAVI. Several factors may account for this difference and are consistent with our findings. First, the patient population in the latter study was younger (mean age, 76 vs 81 y), which aligns with our subgroup analysis. We observed a significant interaction between age and elevated Lp(a) level with respect to long‑term overall survival—worse long‑term outcomes accompanied by high Lp(a) levels were more pronounced in younger patients (Figure 2B). A plausible explanation is that younger patients have a longer remaining life expectancy, during which they are exposed to the harmful effect of elevated Lp(a) levels. Additionally, the burden of comorbidities and frailty increasing with age may mask the impact of high Lp(a) levels on long‑term outcomes. The second factor that needs to be considered is the Lp(a) cutoff value. Bormann et al20 used a threshold of 60 mg/dl, whereas Hu et al15 adopted a threshold of 30 mg/dl. As shown in our sensitivity analysis, the higher Lp(a) cutoff is set, the more attenuated the difference between the groups becomes. Consistently, in the study by Hu et al,15 the effect size was smaller in the model using 50 mg/dl as the Lp(a) cutoff (HR, 1.51; 95% CI, 1.02–2.24) than in the model using 30 mg/dl as the threshold (HR, 1.81; 95% CI, 1.27–2.57).
To the best of our knowledge, this is the first study to report the 12‑month MACCE prevalence after TAVI depending on Lp(a) level. Previous studies found no difference in in‑hospital or 30‑day events, such as mortality, stroke, or myocardial infarction.15,20 Consistent with these findings, we did not observe any differences during 12‑month follow‑up in the composite MACCE end point or in its individual components for which the analyses were feasible.
It is important to consider potential mechanisms in which elevated Lp(a) levels could translate into worse long‑term outcomes after TAVI. Lp(a) is a highly atherogenic particle and, in the same way it promotes calcification of the native aortic valve,21 it may contribute to degeneration of a bioprosthetic aortic valve. Indeed, a recent study showed that high Lp(a) levels (≥30 mg/dl) were independently associated with bioprosthetic aortic valve degeneration as assessed on echocardiography.14 Another study reported an association between elevated Lp(a) level and the risk of hypoattenuating leaflet thickening after TAVI.16 Furthermore, elevated Lp(a) level increases overall cardiovascular risk, which likely affects the long‑term overall survival.22
The observed differences in TC and triglyceride levels warrant a brief discussion. The patients with a high Lp(a) level had higher TC levels despite a numerically higher prevalence of statin use (89.7% vs 76.2%; P = 0.15; Supplementary material, Table S3). This finding should be interpreted with caution, because Lp(a)-cholesterol level contributes to TC level making the 2 variables interdependent. Triglyceride levels were lower in the high‑Lp(a) group but given the small sample size and the observational nature of this study, it cannot be reliably determined whether this difference is attributable to pharmacotherapy or other factors.
Although no targeted Lp(a)-lowering therapy has yet been approved for clinical use, several phase 2 and 3 clinical trials are ongoing, and their results are expected in the upcoming months.8,9 If these studies demonstrate that Lp(a)-targeted drugs reduce cardiovascular risk, new indications for their use will likely be considered, including in patients with AS or those undergoing TAVI. Regardless of these future perspectives, it is essential to pay special attention to the optimal management of all modifiable risk factors in patients with high Lp(a) levels undergoing TAVI. As mentioned above, current ESC guidelines recommend measuring Lp(a) levels at least once in each adult’s lifetime.12 Nevertheless, real‑world practice still needs improvement, particularly through increasing the awareness of Lp(a) level importance among health care professionals.23,24
Limitations
There are several limitations to our study that should be acknowledged. First, the Lp(a) level measurements were available only in the patients with an adequate stored plasma sample, resulting in a reduced size of the analyzed cohort. This may have introduced selection bias and limit applicability of our findings to the general TAVI population. Second, the relatively small number of patients may have limited the statistical power to detect some associations. Nevertheless, we observed a significant difference in overall survival and identified other potentially important trends, which should be interpreted as exploratory. Further, we did not adjust our analyses for cholesterol or triglycerides levels, which differed between the groups, because full lipid panel was available only for about 70% of the patients. Nevertheless, the observed difference in TC is expected, as Lp(a)-cholesterol concentration contributes to TC level. Adjusting for TC could even lead to overadjustment and attenuation of the effect of Lp(a) level mediated via the cholesterol‑related pathway. Last, Lp(a) levels were measured several years after blood sample collection, using an ELISA in platelet‑depleted plasma. As a consequence, the absolute Lp(a) values may not be directly comparable with commonly used thresholds, and the distribution of Lp(a) concentrations in our cohort seems right‑shifted in comparison with previous studies. However, this systematic shift in Lp(a) levels likely impacts all patients in the same way, and thus the relative differences between the groups categorized by Lp(a) levels remain significant and clinically meaningful.
Conclusions
Patients with severe AS and elevated Lp(a) level have a comparable risk of 12‑month MACCE after TAVI to those with low Lp(a) level, while unadjusted analyses showed a trend toward worse long‑term survival in the high‑Lp(a) group. Based on the exploratory analyses, the difference in long‑term mortality appears more pronounced in younger patients with a lower burden of comorbidities. These findings require confirmation in larger cohorts.
- Iung B, Delgado V, Rosenhek R, et al. Contemporary presentation and management of valvular heart disease: the EURObservational Research Programme Valvular Heart Disease II Survey. Circulation. 2019; 140: 1156‑1169. | Crossref
- Braunwald E. Aortic stenosis: then and now. Circulation. 2018; 137: 2099‑2100. | Crossref
- Osnabrugge RLJ, Mylotte D, Head SJ, et al. Aortic stenosis in the elderly. JACC. 2013; 62: 1002‑1012. | Crossref
- Praz F, Borger MA, Lanz J, et al. 2025 ESC/EACTS Guidelines for the management of valvular heart disease: developed by the Task Force for the management of valvular heart disease of the European Society of Cardiology (ESC) and the European Association for Cardio‑Thoracic Surgery (EACTS). Eur Heart J. 2025; 46: 4635‑4736. | Crossref
- Puri R, Iung B, Cohen DJ, et al. TAVI or no TAVI: identifying patients unlikely to benefit from transcatheter aortic valve implantation. Eur Heart J. 2016; 37: 2217‑2225. | Crossref
SUPPLEMENTARY MATERIAL
ARTICLE INFORMATION