Association of intrarenal blood flow with renal function and target organ damage in hypertensive patients with fibromuscular dysplasia: the ARCADIA-POL study
Key words: fibromuscular dysplasia, intrarenal blood flow parameters, kidney, renal artery stenosis, renal resistive index


 CC BY-NC-SA 4.0
Association of intrarenal blood flow with renal function and target organ damage in hypertensive patients with fibromuscular dysplasia: the ARCADIA-POL study
Introduction: Data on the assessment of intrarenal blood flow parameters in patients with renal fibromuscular dysplasia (FMD) are scarce.
Objectives: The aim of the study was to evaluate intrarenal blood flow parameters in patients with FMD and significant or nonsignificant renal artery stenosis (RAS).
Patients and methods: We evaluated intrarenal blood flow parameters by Doppler ultrasonography in 153 patients with renal FMD enrolled in the ARCADIA‑POL study: 32 and 121 patients with and without significant RAS, respectively, compared with 60 matched patients with essential hypertension and 60 healthy controls.
Results: Patients with FMD and significant RAS had a lower renal resistive index (RRI) compared with patients with FMD without significant RAS, patients with essential hypertension, and normotensive controls (mean [SD], 0.51 [0.08] vs 0.60 [0.07], 0.62 [0.06], and 0.61 [0.06], respectively; P <0.001). In patients with nonsignificant RAS, RRI correlated significantly with carotid intima–media thickness, 24‑hour diastolic blood pressure, 24‑hour pulse pressure, left ventricular diastolic function, known duration time of hypertension, and age. In patients with significant RAS, there was a significant correlation between RRI and known duration time of hypertension, left ventricular diastolic function, and age. In a separate, “per‑kidney” analysis, renal arteries with FMD and significant RAS were characterized by lower RRI values, higher maximal blood flow velocity, higher renal aortic ratio, and longer acceleration time compared with renal arteries with FMD and nonsignificant RAS as well as renal arteries without FMD.
Conclusions: In contrast to atherosclerotic RAS, intrarenal blood flow in patients with FMD and RAS is preserved, confirming that renal vasculature is relatively intact in these patients.
Introduction
Fibromuscular dysplasia (FMD) is an idiopathic, segmental, nonatherosclerotic, and noninflammatory disease of the musculature of arterial walls, leading to the stenosis of small- and medium‑sized arteries.1
The recent advances in the understanding of the pathophysiology and natural history of FMD have been driven by data from international patient registries and multicenter research collaborations, still providing new insights into the clinical characteristics of patients with this disease.1
A recent study evaluating renal hemodynamic parameters in patients with multifocal renal FMD has indicated that renal blood flow and glomerular filtration rate are preserved in the kidneys of those patients. This may suggest that the renal function and kidney vasculature are intact in patients with FMD and comparable to those in patients with essential hypertension.2
Among intrarenal blood flow parameters, the renal resistive index (RRI), derived from the Doppler pulsatile flow‑velocity waveform, correlates significantly with renal structural changes and outcomes in patients with essential hypertension or kidney diseases.3
However, most studies evaluating the RRI were conducted in patients with atherosclerotic renal artery stenosis (RAS), and there are scarce data on the relationship between RRI and target organ damage in patients with renal FMD.4
Therefore, we performed a study that aimed to evaluate RRI values in patients with either significant or nonsignificant RAS (both in the per‑patient and per‑kidney analysis) and to evaluate RRI values in FMD patients in relation to renal function and other early target organ damage parameters.
Patients and methods
From January 2015 until September 2017, 272 patients entered the multicenter ARCADIA‑POL study involving 32 centers in Poland. Each of these centers followed a referral pattern and identified patients with newly diagnosed or established or suspected renal FMD; FMD in other vascular beds; or with spontaneous artery dissection (particularly in carotid, vertebral, or coronary arteries). In all patients, the following were performed: biochemical evaluation, biobanking, ambulatory blood pressure monitoring (ABPM), computed tomography angiography (CTA), and duplex Doppler ultrasonography of carotid and renal arteries. Renal FMD was confirmed in 171 patients. We excluded 13 patients with a history of ischemic heart disease, heart failure, myocardial infarction, or diabetes mellitus, as well as 5 patients with no data from echocardiographic and Doppler examinations. Thus, the evaluated group consisted of 153 patients with renal FMD (Supplementary material, Figure S1).
Two reference groups consisting of 60 patients with essential hypertension and 60 normotensive controls, matched for sex, age, and body mass index (BMI) were also assessed. Patients with essential hypertension were also matched for blood pressure (BP) levels on ABPM with patients with FMD.
The protocol of the ARCADIA‑POL study was approved by the Ethics Committee (No. 1482) of the Institute of Cardiology, Warsaw, Poland, and written informed consent was obtained from all participants.
Computed tomography angiography
The CTA of the abdominal aorta and its branches was performed. Arterial phase contrast‑enhanced images were obtained using a dual‑source CT scanner, SOMATOM Force (collimation, 192 × 0.6 mm; spatial resolution, 0.24 mm; rotation time, 0.25 s; slice thickness, 0.6–1 mm) (Siemens, Erlangen, Germany).4 FMD was defined as nonatherosclerotic arterial encroachment or stenosis of medium‑sized arteries, and no aortic wall thickening or biochemical evidence of inflammatory process. Moreover, renal FMD was divided into multifocal or unifocal.5 The diagnosis of FMD and its types was established by 2 independent investigators (MJ and IM).
Patients with renal FMD were classified additionally as: 1) patients with significant RAS on the present examination, defined as signs of significant stenosis on duplex Doppler examination and/or CTA and verified in most cases by renal angiography; 2) patients with FMD in renal arteries and nonsignificant RAS who did not fulfil the criteria of significant RAS on the present examination (confirmed by duplex Doppler and CTA).
Renal ultrasound and Doppler studies
For renal ultrasound, a Logiq E9 (GE, Boston, Massachusetts, United States) with a multiphase 2- to 4‑MHz convex array transducer was used. Aortic and renal maximum flow velocities were measured and the renal aortic ratio (RAR) was calculated. The value of RAR exceeding 3.5 was used to identify significant RAS. The intrarenal arteries were visualized in a color duplex mode. Measurements were obtained from interlobular arteries (on the level of the edge of the pelvis and parenchyma). Doppler ultrasound spectral analysis included mean RRI (peak systolic velocity – end‑diastolic velocity/peak systolic velocity) obtained from 3 Doppler curves at different sites of each kidney. Duplex scanner software was used for calculation. The difference in RRI between the kidneys was expressed as ΔRRI. For each patient, a mean RRI based on the RRI calculated in the left and right kidney was calculated. We performed a separate, per‑kidney analysis, in which we evaluated RRI values from each kidney separately. The measurements were made by 2 experienced investigators, blinded to the clinical status of patients. Interobserver and intraobserver coefficients of variance of the RRI were 5.6% and 4.7%, respectively (n = 12).
Blood samples
Blood samples were taken after overnight fasting. Lipid profiles, serum sodium, potassium, and creatinine concentrations were determined by routine assays. We calculated the estimated glomerular filtration rate (eGFR) based on the Chronic Kidney Disease Epidemiology Collaboration formula.6
Evaluation of blood pressure values and target organ damage
The methodology of BP measurements, including ABPM, echocardiography, and carotid intima–media thickness (IMT) by carotid artery ultrasound was described previously.4,7,8 Hypertension was defined as a BP higher than or equal to 140/90 mm Hg or current antihypertensive treatment.
Statistical analysis
Data were presented as a mean (SD) and as a median (interquartile range); frequency was presented as a percentage. Continuous and discrete variables were compared using the t test and the Mann–Whitney test, and categorical variables as well as the prevalence rates were compared using the χ2 test or the Fisher exact test. Multiple comparisons between the 4 groups were performed by the 1‑way analysis of variance. The Pearson correlation was used to investigate the correlation of variable factors with echocardiographic parameters. The parameters identified as significantly correlating with RRI were included in the multivariate linear regression models to determine the combined effect of several variables on RRI. The analysis was performed using PASW Statistics 18 (SPSS Inc., Chicago, Illinois, United States). A P value of less than 0.05 was considered significant.
Results
We included 153 patients with renal FMD, 60 matched patients with hypertension (P = 0.38 for sex, P = 1.0 for age, P = 0.34 for BMI, P = 0.12 for 24‑hour systolic BP on ABPM as compared with FMD patients) and 60 healthy controls (P = 0.12 for sex, P = 1.0 for age, and P = 0.59 for BMI as compared with FMD patients). Patients with renal FMD were divided into 2 groups: patients with nonsignificant RAS (n = 121) and those with significant RAS (n = 32). There were no significant differences in clinical characteristics between the 4 groups, except the lower age and higher office and ambulatory BP levels in patients with significant RAS in comparison with the other groups and lower 24‑hour systolic and diastolic BP in patients with nonsignificant RAS in comparison with patients with primary hypertension (Table 1).
Parameter | Renal FMD with nonsignificant RAS (1) (n = 121) | Renal FMD with significant RAS (2) (n = 32) | Normotensive controls (3) (n = 60) | Essential hypertension (4) (n = 60) | P value | |||||
ANOVA | 1 vs 2 | 1 vs 3 | 1 vs 4 | 2 vs 3 | 2 vs 4 | |||||
Data are presented as mean (SD) unless otherwise stated.
Abbreviations: ANOVA, analysis of variance; BMI, body mass index; DBP, diastolic blood pressure; eGFR, estimated glomerular filtration rate; FMD, fibromuscular dysplasia; HR, heart rate; IMT, intima–media thickness; PP, pulse pressure; RAS, renal artery stenosis; RRI, renal resistive index; SBP, systolic blood pressure | ||||||||||
Females, % (n) | 83.0 (93) | 83.9 (26) | 73.3 (44) | 80 (40) | – | 0.91 | 0.15 | 0.62 | 0.28 | 0.65 |
Age, y | 47.4 (15.2) | 37.3 (10.6) | 42.3 (8.9) | 43.3 (11.4) | <0.001 | 0.001 | 0.06 | 0.25 | 0.41 | 0.21 |
BMI, kg/m2 | 25.0 (3.9) | 23.8 (3.6) | 24.0 (3.1) | 25.6 (3.7) | 0.04 | 0.68 | 0.48 | 1.00 | 1.00 | 0.18 |
HR, bpm | 76.7 (14.4) | 77.4 (12.1) | 79.6 (10.6) | 77.4 (11.6) | 0.74 | 1.00 | 1.00 | 1.00 | 1.00 | 1.00 |
Clinical SBP, mm Hg | 133.8 (21.1) | 142.2 (20.5) | 124.1 (12.6) | 143.2 (19.6) | <0.001 | 0.27 | 0.049 | 0.047 | 0.002 | 1.00 |
Clinical DBP, mm Hg | 81.6 (10.6) | 92.6 (13.8) | 82.2 (8.1) | 92.0 (13.4) | <0.001 | <0.001 | 1.00 | <0.001 | 0.006 | 1.00 |
24‑hour SBP, mm Hg | 122.2 (11.8) | 136.6 (19.5) | 115.7 (8.0) | 128.0 (11.6) | <0.001 | <0.001 | 0.03 | 0.002 | <0.001 | 0.03 |
24‑hour DBP, mm Hg | 74.7 (7.7) | 84.1 (12.8) | 74.8 (5.8) | 80.2 (9.9) | <0.001 | <0.001 | 1.00 | 0.002 | <0.001 | <0.001 |
Clinical PP, mm Hg | 51.0 (14.5) | 51.2 (13.9) | 40.9 (7.9) | 50.7 (12.2) | <0.001 | 1.00 | <0.001 | 1.00 | 0.02 | 1.00 |
24‑hour PP, mm Hg | 47.6 (9.0) | 52.2 (12.9) | 41.0 (5.4) | 47.8 (7.5) | <0.001 | 0.07 | 0.001 | 1.00 | <0.001 | 0.22 |
Daytime PP, mm Hg | 49.1 (12.1) | 53.5 (12.6) | 41.7 (6.0) | 48.4 (7.9) | <0.001 | 0.46 | <0.001 | 1.00 | <0.001 | 0.37 |
Nighttime PP, mm Hg | 44.7 (12.1) | 48.9 (18.6) | 40.7 (4.9) | 47.4 (8.3) | 0.02 | 0.46 | 0.45 | 1.00 | 0.02 | 1.00 |
Creatinine, µmol/l | 72.4 (13.2) | 75.9 (15.4) | 75.2 (14.2) | 69.1 (14.0) | 0.08 | 0.97 | 1.00 | 0.96 | 1.00 | 0.19 |
eGFR, ml/min 1.72 m2 | 90.6.0 (18.5) | 93.6 (17.9) | 91.4 (15.3) | 98.5 (16.4) | 0.06 | 0.98 | 1.00 | 0.06 | 1.00 | 1.00 |
RRI | 0.60 (0.07) | 0.51 (0.08) | 0.61 (0.06) | 0.62 (0.06) | <0.001 | <0.001 | 1.00 | 0.35 | <0.001 | <0.001 |
Patients with FMD and significant RAS were characterized by the lowest mean RRI values, as compared with patients with FMD and nonsignificant RAS as well as the other groups (Table 1). Additionally, RRI was higher in patients with FMD and significant RAS compared with those with FMD and nonsignificant RAS (mean [SD], 0.083 [0.06] vs 0.038 [0.04]; P <0.001). There were no differences in the serum creatinine level (mean [SD], 75.9 [15.4] vs 72.4 [13.2] µmol/l; P = 0.97), eGFR (mean [SD], 93.6 [17.9] vs 90.6.0 [18.5] ml/min/1.72 m2; P = 0.98), urinary albumin excretion (mean [SD], 16.7 [10.6] vs 18.9 [19.3] mg/24 h; P = 0.48), IMT (mean [SD], 6.6 [2.0] vs 6.3 [2.0] mm; P = 0.51), and echocardiographic parameters in patients with FMD and significant RAS compared with those with FMD and nonsignificant RAS.
In patients with FMD without significant RAS, the following factors significantly correlated with mean RRI: age, known duration of hypertension, IMT, clinical systolic BP, 24‑hour diastolic BP, 24‑hour pulse pressure (PP), and E/e’ ratio (defined as peak velocity of early diastolic transmitral flow/peak velocity of early diastolic mitral annular motion as determined by pulsed wave Doppler) (Table 2). In the multivariate model, E/e’ (β coefficient, 0.35; P = 0.001) and 24‑hour PP (β coefficient, 0.322; P = 0.002) significantly and independently correlated with RRI. In patients with FMD and significant RAS, mean RRI significantly correlated with age, known duration of hypertension, and E/e’ (Table 3). In the multivariate model, age (β coefficient, 0.415; P = 0.008) and known duration of hypertension (β coefficient, 0.318; P = 0.038) significantly and independently correlated with RRI.
Parameter | r coefficient | P value |
Abbreviations: e’, early diastolic mitral annular velocity; E/A, peak velocity of early diastolic transmitral flow/peak velocity of early diastolic mitral annular motion as determined by pulsed wave Doppler; E/e’, peak velocity of early diastolic transmitral flow/peak velocity of early diastolic mitral annular motion as determined by pulsed wave Doppler; GLS, global longitudinal strain; LAVI, left atrial volume index; LVEF, left ventricular ejection fraction; LVM, left ventricular mass; RWT, relative wall thickness; others, see Table 1 | ||
Age | 0.214 | 0.02 |
BMI | 0.078 | 0.39 |
IMT | 0.333 | 0.003 |
Creatinine | 0.048 | 0.60 |
eGFR | 0.069 | 0.53 |
Urinary albumin excretion | 0.036 | 0.80 |
Clinical SBP | 0.239 | 0.01 |
Clinical DBP | – 0.046 | 0.63 |
24‑hour SBP | 0.056 | 0.54 |
24‑hour DBP | – 0.331 | 0.001 |
24‑hour PP | 0.334 | 0.001 |
Daytime SBP | 0.029 | 0.77 |
Daytime DBP | – 0.333 | 0.001 |
Nighttime SBP | 0.118 | 0.22 |
Nighttime DBP | – 0.118 | 0.23 |
Nighttime SBP decline | – 0.071 | 0.49 |
Nighttime DBP decline | – 0.083 | 0.39 |
Known duration time of hypertension | 0.370 | 0.001 |
GLS | 0.141 | 0.15 |
LAVI | 0.113 | 0.37 |
LVEF | 0.251 | 0.60 |
LVM/height2.7 | – 0.033 | 0.63 |
RWT | 0.08 | 0.40 |
E/A | – 0.079 | 0.41 |
e’ | – 0.137 | 0.17 |
E/e’ | 0.301 | 0.003 |
Parameter | r coefficient | P value |
Age | 0.215 | 0.02 |
BMI | 0.121 | 0.19 |
IMT | – 0.22 | 0.09 |
Creatinine | – 0.005 | 0.98 |
eGFR | – 0.036 | 0.19 |
Urinary albumin excretion | 0.028 | 0.91 |
SBP clinical | 0.239 | 0.12 |
DBP clinical | – 0.006 | 0.98 |
24‑hour SBP | 0.075 | 0.72 |
24‑hour DBP | – 0.220 | 0.13 |
24‑hour PP | 0.217 | 0.17 |
Day‑time SBP | – 0.052 | 0.79 |
Day‑time DBP | – 0.185 | 0.33 |
Nighttime SBP | 0.012 | 0.98 |
Nighttime DBP | – 0.249 | 0.16 |
Nighttime SBP decline | – 0.125 | 0.55 |
Nighttime DBP decline | – 0.258 | 0.17 |
Known duration time of hypertension | – 0.366 | 0.001 |
GLS | 0.174 | 0.46 |
LAVI | 0.193 | 0.51 |
LVEF | 0.134 | 0.54 |
LVM/height2.7 | 0.193 | 0.15 |
RWT | 0.31 | 0.13 |
E/A | 0.027 | 0.90 |
e’ | – 0.362 | 0.11 |
E/e’ | – 0.466 | 0.02 |
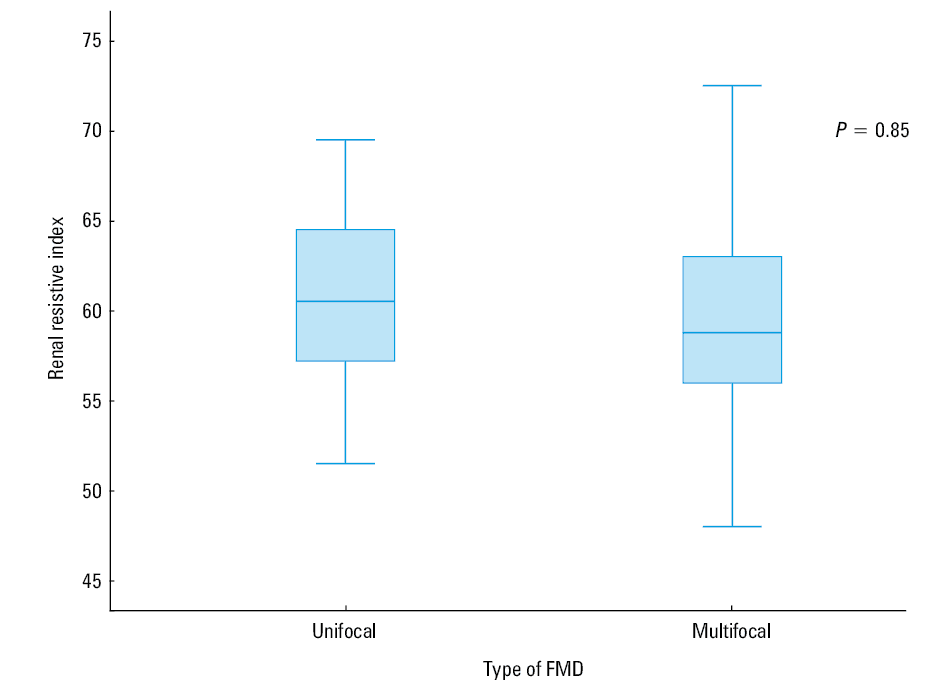
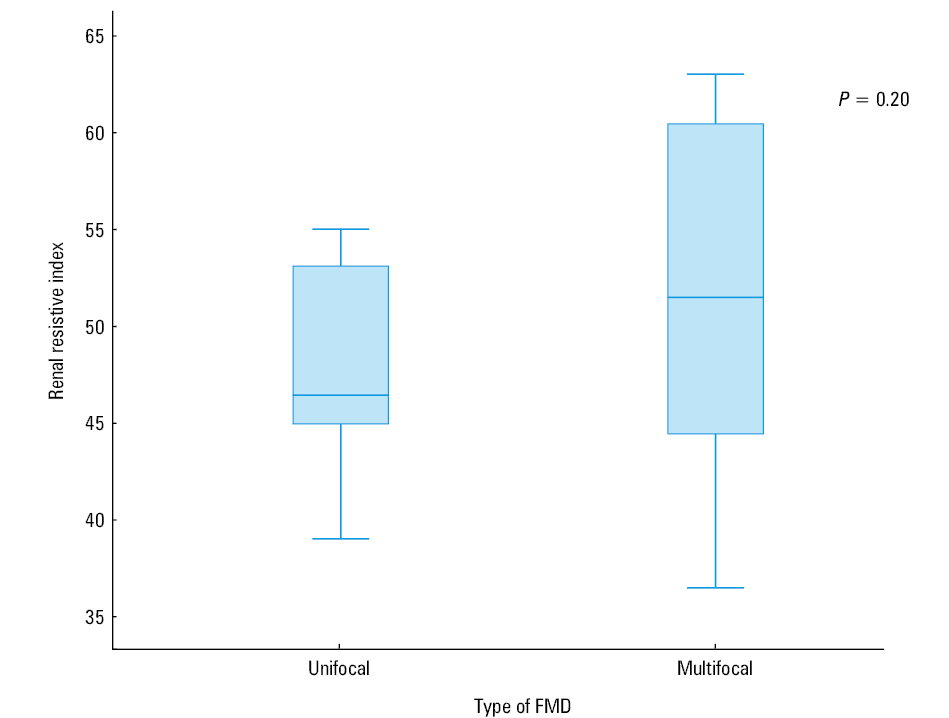
We also analyzed RRI values separately according to the type of FMD found on CTA. In patients with nonsignificant RAS, no significant differences were found in mean RRI between multifocal or unifocal type of FMD (Figure 1). No differences in mean RRI and in ΔRRI were found between patients with significant RAS and multifocal or unifocal types of FMD (Figure 2).
Subsequently, the per‑kidney analysis was performed to evaluate Doppler indices in each kidney separately. Three groups of renal artery anatomy in patients with FMD were established: renal arteries with no FMD lesions (n = 84), renal arteries with FMD lesions and nonsignificant RAS (n = 180), and renal arteries with FMD lesions and significant RAS (n = 37) (Table 4). In renal arteries with significant RAS, lower mean RRI, higher mean maximal blood flow velocity, higher mean RAR, and higher mean acceleration time were found as compared with renal arteries with FMD lesions and nonsignificant RAS as well as with renal arteries without FMD lesions. No differences in intrarenal blood flow parameters were found between renal arteries with FMD and nonsignificant RAS and renal arteries with no FMD lesions.
Parameter | Renal arteries without FMD lesions (1) (n = 84) | Renal arteries with FMD lesions without significant RAS (2) (n = 180) | Renal arteries with FMD lesions and significant RAS (3) (n = 37) | P value | |||
ANOVA | 1 vs 2 | 1 vs 3 | 2 vs 3 | ||||
Data are presented as mean (SD).
Abbreviations: AT, acceleration time; PI, pulsatility index; RAR, renal aortic ratio; Vmax, maximal blood flow velocity; others, see Table 1 | |||||||
Length of kidney, mm | 112.4 (10.1) | 108.4 (10.7) | 107.4 (8.2) | 0.05 | 0.09 | 0.14 | 1.00 |
Vmax, cm/s | 116.0 (43.8) | 151.7 (57.7) | 314.8 (105.6) | <0.001 | <0.001 | <0.001 | <0.001 |
RAR | 1.18 (0.47) | 1.89 (0.75) | 4.19 (2.09) | <0.001 | 0.005 | <0.001 | <0.001 |
RRI | 0.60 (0.06) | 0.59 (0.07) | 0.47 (0.09) | <0.001 | 0.50 | <0.001 | <0.001 |
AT | 20.2 (7.6) | 24.2 (12.2) | 61.4 (32.0) | <0.001 | 0.16 | <0.001 | <0.001 |
PI | 1.08 (0.18) | 1.09 (0.19) | 1.12 (0.22) | 0.64 | 1.00 | 1.00 | 1.00 |
Discussion
Duplex Doppler ultrasonography has been proved as a useful and noninvasive tool for evaluating renal vasculature, by means of RRI, in several different pathological conditions, including atherosclerotic RAS, acute kidney injury, acute and chronic graft rejection, arterial hypertension, and diabetes mellitus.9-13 It should be noted, however, that studies focusing on poststenotic RRI were performed mostly in patients with atherosclerotic RAS, and available evidence in patients with renal FMD is scarce.3,9
To our best knowledge, the present study for the first time systematically evaluated the value of RRI in a large group of patients with FMD and renal artery lesions, which was compared with age‑matched patients with essential hypertension and normotensive controls.
One of the most important findings of our study was that in patients with significant RAS, the poststenotic intrarenal RRI was significantly lower and ΔRRI was significantly higher than in patients with nonsignificant RAS, those with essential hypertension, and healthy controls. Similarly, in the per‑kidney analysis, significantly lower RRI values were obtained in the kidneys with significant RAS, compared with the kidneys with nonsignificant RAS, along with significant differences in other intrarenal parameters, including acceleration time, and extrarenal parameters, including RAR and maximal blood flow velocity.
Our results are in line with a study by Krumme et al,9 who documented that the poststenotic RRI was lower as compared with normal kidneys. This finding may be explained by the decrease of systolic renal blood flow velocity beyond the stenosis, and also by the fact that while end‑diastolic velocity increases in a stenotic renal artery, RRI decreases; moreover, the more severe the RAS, the lower the RRI.9 The comparison of RRI parameters between patients with atherosclerotic RAS and those caused by FMD is particularly interesting.9 Accordingly, their study showed that in patients with significant RAS, ΔRRI was higher and RRI values were lower in patients with severe FMD as compared with those with atherosclerotic RAS. However, the number of patients with FMD in this study was much lower than in the present study.
The poststenotic flow pattern is influenced by the compliance of the poststenotic vessel wall. The lower RRI in FMD patients with significant RAS may be explained by unaltered compliance of renal arteries in this population. Therefore, a lower RRI is measured in vessels with high compliance.3,9
Of note, a recent study documented that in patients with FMD the infusion of vasoactive substances into the kidneys resulted in vasodilation or vasoconstriction at a magnitude similar to that in essential hypertension. This indicates that renal blood flow can be modulated in individual FMD patients, confirming the hypothesis that renal vasculature is relatively intact in patients with FMD.14,15
These findings are in contrast to those demonstrated in patients with atherosclerotic RAS, in whom the vasoactive effects of infusion of angiotensin (1–7) and a nitric oxide synthase inhibitor are substantially reduced.14 In contrast to atherosclerotic RAS, little is known about intrarenal hemodynamics in FMD patients.2,14 The recent findings of van Twist et al14 showed that renal blood flow in the kidneys with FMD of renal arteries is comparable to that in essential hypertension. Moreover, no differences in the mean renal blood flow were found between the affected and unaffected kidney in patients with unilateral multifocal RAS, suggesting that “string of beads” does not seriously affect local blood flow.14 These authors also documented that eGFR was comparable between the kidneys of patients with renal FMD and essential hypertension. However, van Twist et al14 did not focus on evaluation of RRI by duplex Doppler.14
Our study in a large group of patients with FMD with nonsignificant RAS showed for the first time that RRI was in the lower range of normal values, comparable to those in patients with essential hypertension and healthy controls. One may suggest that in patients with FMD who are free from diabetes mellitus, cardiovascular complications, and overt atherosclerosis, functional and structural factors contributing to renal blood flow and intraparenchymal arterial waveform result in unaltered intrarenal vascular compliance.
Another relevant finding of our study is the lack of a relationship between RRI and renal function, as documented by the fact that in patients with significant and nonsignificant RAS, no correlation was found between RRI values and creatinine and eGFR. Of note, several available studies have provided conflicting results, which may be attributed to different underlying diseases including chronic renal disease, essential hypertension, and diabetes mellitus.16-19 In those reports, RRI correlated not only with patients’ age and BP, but also with serum creatinine concentrations and creatinine clearance.17-19 In the study of Ikee et al,18 who evaluated patients with a biopsy‑proven chronic kidney disease, RRI correlated with age and creatinine clearance and also with renal histopathologic characteristics, particularly with arteriolosclerosis. Also, in 112 patients with type 2 diabetes, there was a strong correlation between increased RRI values and creatinine clearance, suggesting that RRI was significantly affected by decreased renal function, advanced age, and long duration of diabetes, the latter 2 factors being related to advanced arteriolosclerosis.20
However, it should be noted that our patients with FMD differed in terms of renal function from those in the above studies and also from patients with atherosclerotic RAS. In the latter group, patients with atherosclerotic RAS were older and had higher systolic BP, atherosclerotic vascular disease elsewhere, and more extensive renal damage.
Of note, the ASTRAL (Angioplasty and Stenting for Renal Artery Lesions)21 and CORAL (Cardiovascular Outcomes in Renal Atherosclerotic Lesions)22 studies enrolled representative groups of patients with atherosclerotic RAS. In the ASTRAL study,21 the mean eGFR in the revascularization and medical therapy groups was 40.3 ml/min and 39.8 ml/min, respectively, and in the CORAL study,22 58.0 ml/min and 57.4 ml/min, respectively.
In our study, no significant correlation was found between RRI and albuminuria in FMD patients with both significant and nonsignificant RAS. However, the prevalence of microalbuminuria in our group with FMD was low (10%). These may further strengthen our observation that renal function is entirely preserved in patients with FMD. In contrast to atherosclerotic RAS, in patients with renal FMD, renal function was preserved in the ARCADIA (Assessment of Renal and Cervical Artery Dysplasia) and Flemish registries, which is in line with our results.23,24
We did not observe correlations between RRI and nighttime BP or a nighttime decline in BP in patients with significant RAS, whereas diminished nighttime decline in BP has been reported in patients with atherosclerotic RAS.25
It should be noted that in patients with FMD and nonsignificant RAS, a significant positive correlation was found between RRI and ambulatory 24‑hour PP. These may suggest a relationship between RRI value and PP, the factors known to be associated with vascular stiffness.
In our study, there was also a positive correlation between RRI and IMT in FMD patients with nonsignificant RAS. Our data are in line with the reports of other authors, who described a relationship between RRI and IMT in patients with essential hypertension, type 2 diabetes, and kidney transplant recipients. Heine et al19 found a significant correlation between RRI, and IMT, ankle‑brachial index, and the Framingham risk score derived from 105 stable renal allografts.
Recently, Schwenger et al26 found that the RRI of 76 patients with renal allografts and stable graft function significantly correlated with the pulse wave velocity of the recipients, obtained from the carotid and femoral arteries. Also, positive correlations were found between RRI and IMT of the femoral and carotid arteries in 112 patients with type 2 diabetes and diabetic nephropathy.20 This provides indirect evidence for the possible contribution of advanced intrarenal vascular changes to increased RRI values. In the study of Derchi et al,27 hypertensive patients with mild renal dysfunction showed increased IMT as compared with those with normal renal function and a positive correlation was found between RRI value and carotid IMT.
In the present study, no significant correlation was found between RRI and echocardiographic parameters of the left ventricular (LV) morphology and function except for a significant correlation of the E/e’ ratio (parameter of LV diastolic function), both in patients with significant and nonsignificant RAS. Kuznetsova et al28 found a relationship between RRI and transmitral diastolic inflow parameters in patients with hypertension. This may indicate a relationship between early cardiac and renal damage. However, the authors used volume‑dependent parameters (mitral flow) for diastolic assessment, whereas we used volume‑independent parameters (early diastolic velocity assessed by tissue Doppler imaging).
We did not find any correlation between LV mass and RRI, which is in contrast to the study of Tedesco et al,29 who found a positive correlation between RRI values and LV mass index. The authors reported that hypertensive patients with an RRI exceeding 70 had an increased LV mass index, with subclinical impairment of LV diastolic function.
It should be also considered that RRI is affected by factors other than the degree of RAS, including nonrenal factors and the location of intrarenal Doppler measurements.10 Moreover, nonrenal factors have an impact on the RRI of the kidneys, including tachycardia, which induces low values of RRI. Similarly, bradycardia induces high values of RRI due to later beginning of the next systolic peak with less end‑diastolic velocity. The RRI should not be used for the diagnosis of RAS, particularly in patients with atrial fibrillation.10 Of note, in our study, all patients with FMD had normal heart rate and none of them presented with atrial fibrillation.
The location of the intrarenal Doppler measurement also influences RRI, since it has been documented that RRI decreases from the hilum of the kidney towards the renal cortex. Therefore, if RRI is calculated from the flow pattern of the hilar artery, higher RRI values may be observed. Considering this nonrenal factor, RRI was measured in all consecutive patients at the level of interlobular arteries.10
Our study in a large cohort of patients with renal FMD documented for the first time that, in contrast to atherosclerotic RAS, intrarenal blood flow and renal function are preserved. This may be explained by unaltered compliance of renal arteries in this generally young population of FMD patients with a relatively short known duration of hypertension and without established target organ damage, diabetes, cardiovascular diseases, and overt atherosclerosis.
Also, a significantly decreased poststenotic RRI, as compared with the kidneys with nonsignificant RAS, may indicate preserved arterial compliance, as documented in patients with FMD with significant RAS. This may also indicate that renal blood flow can be modulated in individual FMD patients, confirming the hypothesis that renal vasculature is relatively intact in patients with FMD.
- Olin JW. Expanding clinical phenotype of fibromuscular dysplasia. Hypertension. 2017; 70: 488‑489. | Crossref
- van Twist DJ, Houben AJ, de Haan MW, et al. Pathophysiological differences between multifocal fibromuscular dysplasia and atherosclerotic renal artery stenosis. J Hypertens. 2017; 35: 845‑852. | Crossref
- Viazzi F, Leoncini G, Derchi LE, et al. Ultrasound Doppler renal resistive index: a useful tool for the management of the hypertensive patient. J Hypertens. 2014; 32: 149‑153. | Crossref
- Dobrowolski P, Januszewicz M, Klisiewicz A, et al. Echocardiographic assessment of left ventricular morphology and function in patients with fibromuscular dysplasia: the ARCADIA‑POL study. J Hypertens. 2018; 36: 1318‑1325. | Crossref
- Savard S, Steichen O, Azarine A, et al. Association between 2 angiographic subtypes of renal artery fibromuscular dysplasia and clinical characteristics. Circulation. 2012; 126: 3062‑3069. | Crossref
SUPPLEMENTARY MATERIAL
ARTICLE INFORMATION